It’s time for me to set a few objectives with which technologies I want to learn more about in 2018. As a reminder for me and to try and not lose focus, I’ve compiled it into a blog post.
vRealize Automation / Orchestration
I’ve always dabbled in automation and orchestration but never really gone “full on”. I used to write a lot of scripts for migrations and such “back in the day”, so I’ll be looking forward to getting my hands dirty again and messing around with automating and orchestrating….all the things.
Docker / Containers
My career pretty much started with mainstream x86 server virtualisation. P2V’s were rife and everyone was losing their minds with technologies such as vMotion. The industry has changed now, and I personally feel the next wave of change in the way we manage applications and the underlying operating system libraries is with containers. Docker is leading the charge and this ties nicely with Automation and Orchestration. VMware integrated containers intrigues me as well, as it bridges a gap between the ops teams that are used to, and familiar with vSphere but are experiencing even more demand to provision, manage, secure and automate containers.
Containers are nothing new and are currently loved by the likes of developers, but from what I’ve read/heard/seen, typical enterprises are approaching with caution.
Kubernetes
Pretty much a follow on from containers. This, in my opinion, is the key driver to take [insert container engine of choice] to prime time, typical enterprise consumption. We all know the likes of Netflix, Facebook, Google are already using containers en masse and with an eye-watering amount of orchestration behind it, but I personally think the uptake from typical enterprises is a lot slower, particularly outside of Dev/Test but we’re getting there.
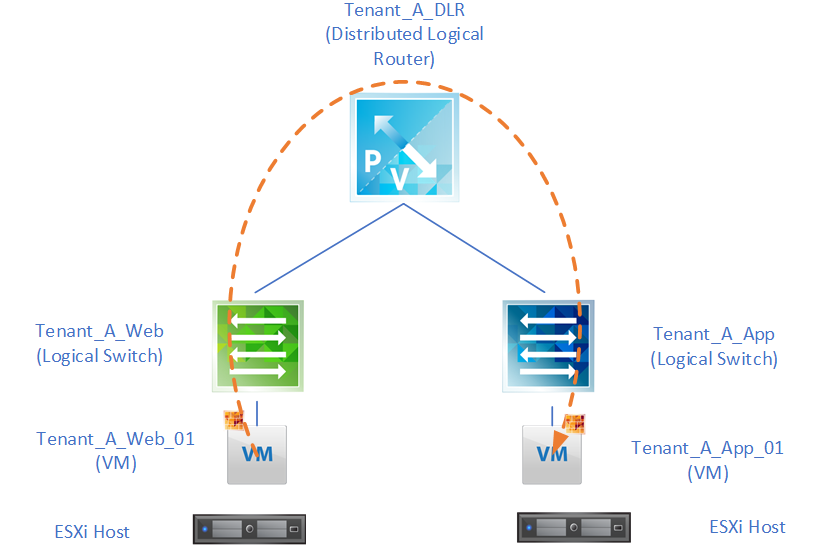
NSX-T
Fitting in with VMware’s ethos of any cloud, any device, anywhere, NSX-T sits as the hyperivsor-agnostic SDN solution. Having already dabbled quite a lot in NSX-V, I’d like to know more about NSX-T and the auxiliary technologies.
Google Cloud
Although some would consider late to the game, I think Google Cloud has potential. I’m already familiar with AWS and I think it’s a good idea to learn another cloud technology, so GCP it is.
Why not Azure? – I’m just not a Microsoft person anymore. Years ago (before Azure was even a thing) I used to be all over Windows Server, AD, Exchange, Group Policies, IIS, DHCP, WSUS etc, took the exams etc. After years of managing this ecosystem, I lost my enthusiasm for it. Bodged windows updates, Windows Server “quirks” and the like – couldn’t deal with it. Therefore I stay away.
“%20” free space on my NIC card? Good job, Windows.
Heck, if work would permit it, I’d run Linux on my company laptop.
Certifications?
Ideally this year I’d like to get:
- VCIX-NV
- Docker Certified Associate
- Certified Kubernetes Administrator
- VCP7-CMA
Recent Comments