Virtual Thoughts

Virtualisation, Storage and various other ramblings.

Page 16 of 25

Hybrid Cloud monitoring with VMware vRealize Operations

Applications and the underlying infrastructure, be it public, private or hybrid cloud are becoming increasingly sophisticated. Because of this, the way in which we monitor and observe these environments requires more sophisticated tools. In this blog post, we look at vRealize Operations and how it can be a facilitator of true hybrid cloud monitoring.

What is vRealize Operations?

vRealize Operations forms part of the overall vRealize suite from VMware – a collection of products targeted to accommodate cloud management and automation. In particular, vRealize Operations, as the name implies, primarily caters to operations management with full visibility across physical, virtual and cloud-based environments. The anatomy of vRealize Operations is depicted below


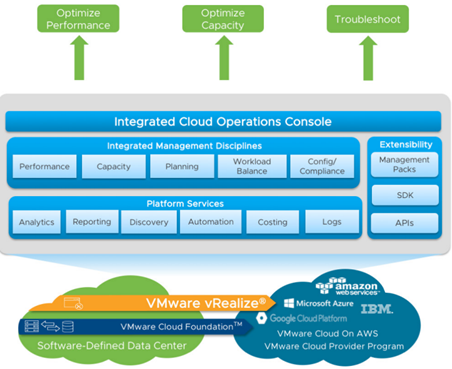
Integrated Cloud Operations Console – A single, unified frontend to access, modify and view all related vRealize Operations components.

Integrated Management Disciplines – vRealize Operations has built-in intelligence to assimilate, dissect and report back on a number of key operational metrics pertaining to performance, capacity, planning and more. Essentially, vRealize Operations “learns” about your environment and is able to make recommendations, predictions and much more based on your specific workloads.

Platform Services – vRealize Operations is able to perform a number of platform management disciplines based on your specific environment. As an example, vRealize Operations can automate the addition of virtual machine memory based on monitored load, therefore proactively addressing potential issues before they surface.

Extensibility – Available from the VMware Marketplace, Management Packs extend the functionality of vRealize Operations. Examples include:

  • Microsoft Azure Management Pack from Blue Medora
  • AWS Management Pack from VMware
  • Docker Management Pack from Blue Medora
  • Dell | EMC Management Pack from Blue Medora
  • vRealize Operations Compliance Pack for PCI from VMware

The examples above demonstrate vRealize Operation’s capability to monitor AWS and Azure environments in addition to on-premises workloads, making vRealize Operations a true platform for Hybrid Cloud monitoring and operations management

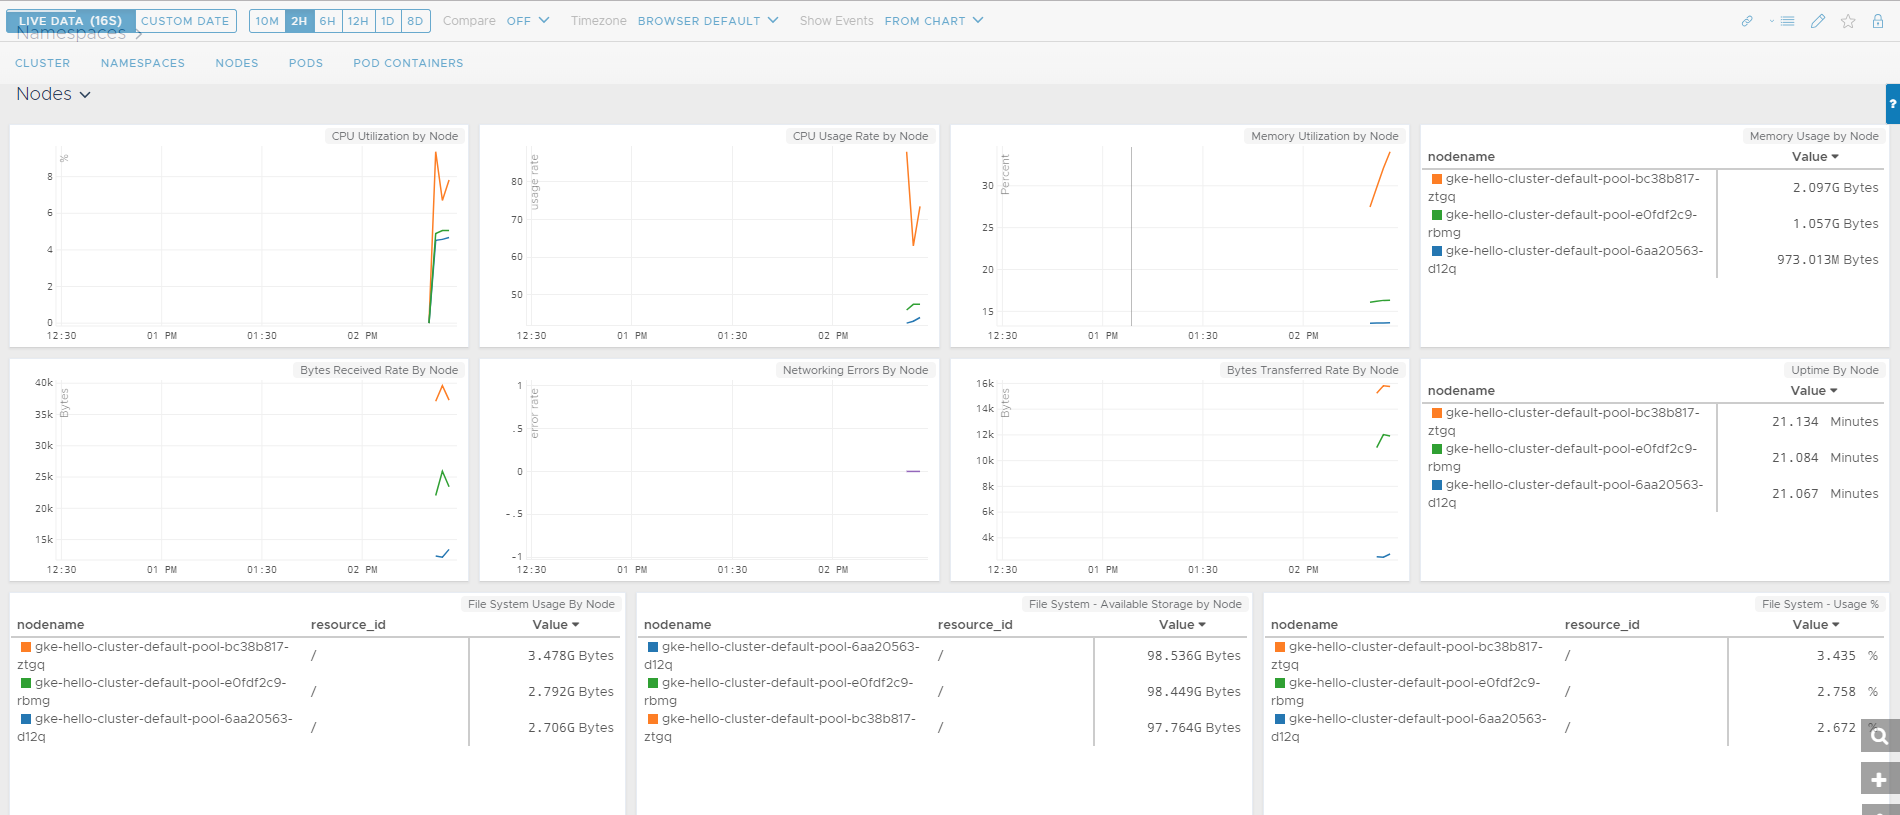
Practical Example – Cluster Monitoring / Troubleshooting

In this example, we leverage one of the vRealize Operation’s built-in dashboards to check the performance of a specific cluster. A dashboard in vRealize operations terminology is a collection of objects and their state, represented in a visual fashion.


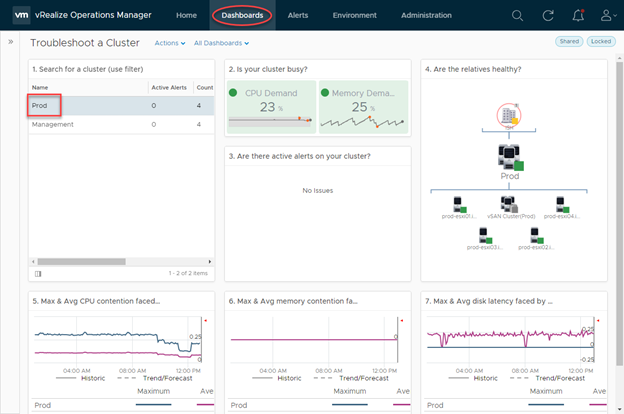
One of the ways vRealize understands the underlying environment is to establish and map dependencies in a logical manner. In this example, we have a top-level datacentre object (ISH), which child objects are decedents of (Cluster and hosts) this dashboard identifies key aspects of this cluster in a single page:

  • Cluster activity / utilisation
  • Health state of associated objects
  • CPU contention information
  • Memory contention information
  • Disk latency information

Without vRealize Operations it would be common for an administrator to try and collate these metrics manually, looking at individual performance charts, DRS scheduling information, and vCenter health alarms. However, with vRealize operations, this data is collected and centralised for easy and effortless exposure.


Practical Example – Workload Planning

In this example, we have an upcoming project that we want to forecast into our environment, particularly around disk space demand. We facilitate this by creating a “Project” in vRealize Operations, but before that, let’s look at the project UI in a bit more detail:


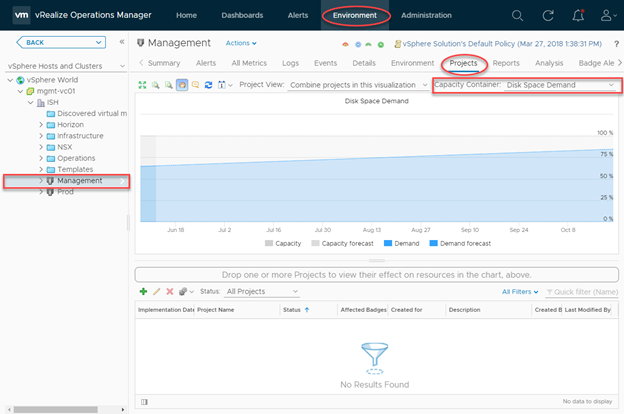
We can access this section by navigating to Environment > vSphere Object. At which point we can select the resource we’re interested in forecasting into. The chart in the middle projects the disk space demand for this specific vSphere object (a cluster, in this example). Note how we have an incline in disk space demand, which is typical of a production environment, however, we are within capacity for the time period specified (90 days).

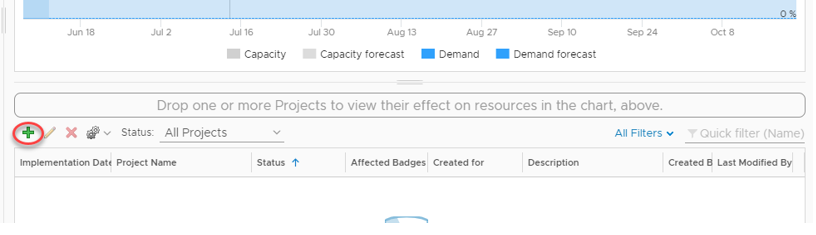
To add a project, we click the green “plus” icon below the chart:


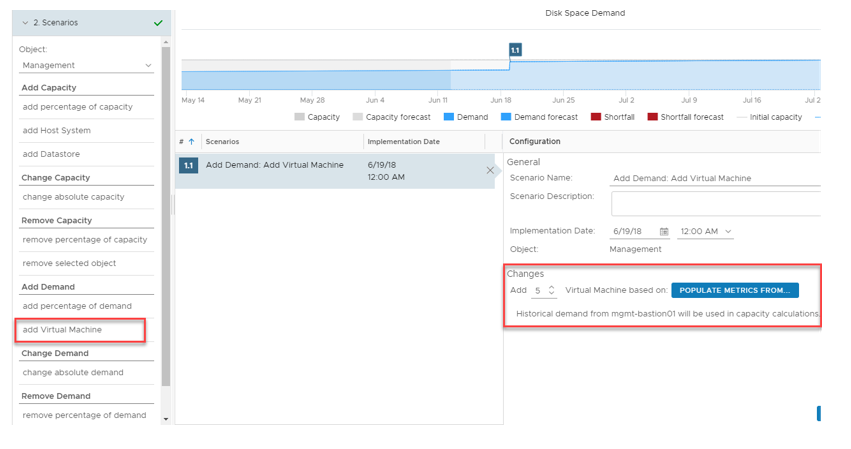
Next, we fill in details pertaining to the demand. In this case, I’m adding demand in the form of 5 virtual machines and I’m populating the specification of these VM’s based on an existing VM in my environment with an implementation date of June 19th.


If we add this project to the forecast chart, the chart changes to accommodate this change in our environment:


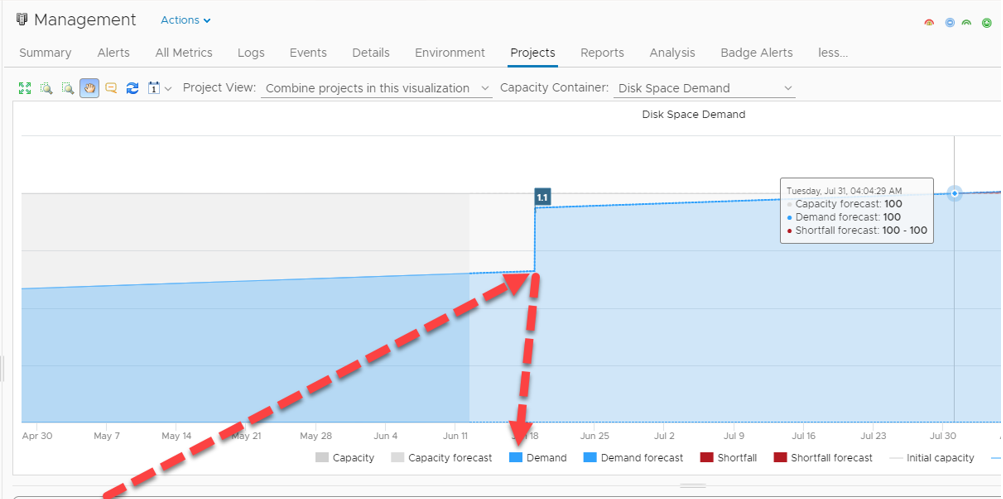
By adding this project we have obviously created more demand, consequently, the date in which our disk space resources will exhaust has been expedited.

By having this knowledge we can plan our capacity requirements ahead of time. In this example, I decide to add another project to add resources prior to the commissioning of the aforementioned VM’s:

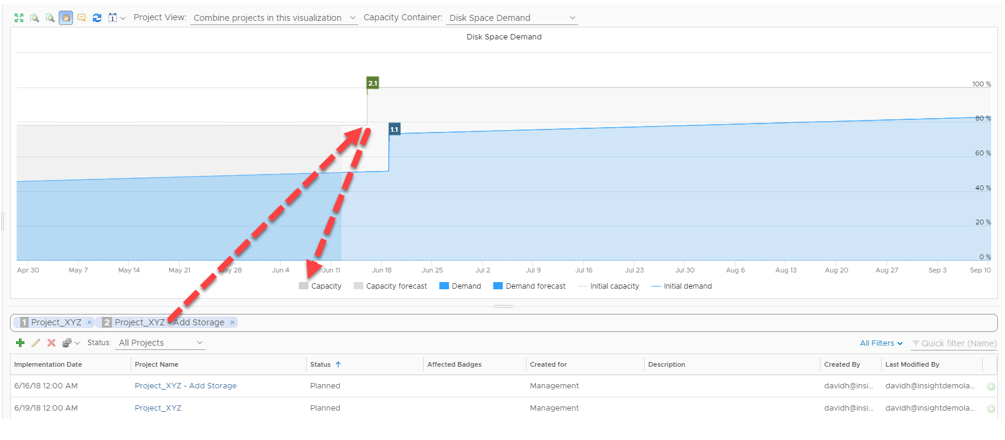
Because we can combine projects into a single chart, we can see based on observed metrics what effect adding demand and capacity to our environment has.

This is one of a vast number of features in vRealize Operations.  vRealize Operations Manager can be an incredibly useful tool to have for a number of reasons. Its intelligent analytics, a breath of extensibility options and unified experience make it a compelling experience for modern cloud-based operations


GCP Kubernetes & VMware Wavefront – a practical demonstration

Wavefront

Back in 2017, VMware acquired Wavefront – a company based in the US which focuses predominantly on real-time metrics and monitoring of a really…really vast array of platforms and technologies. We have technologies that aid in adopting and promoting cloud-native implementations, but monitoring, in some peoples eyes, can be a bit of an afterthought. Wavefront to the rescue. Having developed some Kubernetes and Docker knowledge myself, it seemed rather fitting to get an example going.

GCP – Creating our Kubernetes cluster

To begin with, we need a Google Cloud project. Log into your GCP account and create one:

Access the Kubernetes Engine:

You may have to wait a few minutes for the Kubernetees engine to initialise. Once initialised, create a new Kubernetes cluster:


We have a number of options to define when we create a new Kubernetes cluster:

Note: You are not charged for, or responsible for deploying and maintaining the master nodes. As this is a hosted solution, Google takes care of this for us. As for the cluster options, we have the following base options to get us up and running, all of which should be pretty self-explanatory.

Name – The name for the cluster.
Description – Optional value.
Location – Determines whether our cluster’s master VMs are localised within a single zone or spread across multiple zones in one region.
Zone/Region – Determines where our clusters worker VM’s are localised.
Cluster Version – The version of Kubernetes to be deployed in this cluster.
Node Image – We have two choices, either Container-Optimised OS (cos) or Ubuntu.
Size – Number of nodes in our cluster

One aspect of this wizard I really like is the ability to extract the corresponding REST or CLI command to create the Kubernetes cluster based on the options selected:


Click “Create” to initialise the Kuberntes cluster.


GCP – Deploying a simple application

After waiting a few minutes our Kuberntes cluster has been created:

To connect to it, we can click the “Connect” button which will give us two options:

At this stage, you can deploy your own application, but for me, I deployed a simple application following the instructions located at https://cloud.google.com/kubernetes-engine/docs/tutorials/hello-app


Wavefront and Kubernetes integration

To get started, we need to deploy the following:

  • Wavefront Proxy
  • Wavefront Proxy Service
  • Heapster (Collector Agent)

The YAML files are located at the following URL : https://longboard.wavefront.com/integration/kubernetes/setup

Note that you’ll need a logon to access the above URL. Also, and very cleverly, the generated YAML files contain tokens specific to your account. Therefore, after deploying the YAML files Wavefront will automagically start collecting stats:


Thoughts on wavefront

Once I got everything up and running I was pretty much in awe of the sheer depth of what Wavefront has visibility of.  From my tiny, insignificant environment I’m able to get extremely detailed metrics and content pertaining to:

  • Clusters
  • Namespaces
  • Nodes
  • Pods
  • Pod Containers

In particular, I was very impressed as to how easy it is to get wavefront to ingest data from the likes of GCP hosted K8s.

Introducing the vSAN Driver for Docker

The persistent storage requirement for the container ecosystem

When we talk about containers we generally think about microservices and all things ephemeral. But does this mean that we can’t facilitate stateful workloads leverage persistent storage? Absolutely not.

In the docker world, we choose a storage “driver” to back our persistent storage onto. The driver we choose is based on a number of requirements and which operating system our Docker hosts run. The table below lists the recommended out-of-the-box drivers for Docker Community Edition.

Most of the above are battle-hardened, well-documented drivers. But what if we’re running a vSphere based environment and want to integrate with some vSphere resources?

vSan Storage Driver

Docker introduced the Docker Volume Plugin framework. This extended the integration options between Docker and other storage platforms including (but not limited to):

  • Amazon EBS
  • EMC Scaleio
  • NFS
  • Azure File Services
  • iSCSI
  • VMware based storage
    • vSAN, VMFS


The vSAN Storage Driver for Docker has two components:

vSphere Data Volume Driver

This is installed on the ESXi host and primarily handles the VMDK creation that is requested by the underlying container ecosystem. It also keeps track of the mapping between these entities.


vSphere Docker Volume Plugin

This is installed on the Docker host and primarily acts as the northbound interface that facilitates requests from users / API / CLI to create persistent storage volumes to be used by containers.

From an architectural perspective it looks like this:


Step 1 – The user instantiates a new docker volume, specifying the appropriate driver (ie VMDK).

Step 2 – The vSphere Data Volume Driver accepts the request and communicates via the ESXi host to the underlying storage, which can be vSAN, VMFS or a mounted NFS share.

Why use this?

A distinct advantage of leveraging vSphere-backed storage for containers is how we can utilise native capabilities of the underlying storage infrastructure. For example, if we use vSAN as the backend storage for containers we can leverage:

  • Deduplication
  • Compression
  • Encryption
  • Erasure Coding.
« Older posts Newer posts »

© 2025 Virtual Thoughts

Theme by Anders NorenUp ↑

Social media & sharing icons powered by UltimatelySocial
RSS
Twitter
Visit Us
Follow Me