Virtual Thoughts

Virtualisation, Storage and various other ramblings.

Page 12 of 24

Introducing Velero – Backup and DR for Kubernetes Applications

Image result for velero logo heptio


What is Velero?

Velero (previously known as Heptio ARK) provides a suite of tools to backup Kubernetes resources and applications for two main purposes:

  • Disaster Recovery – Recover Kubernetes cluster components and applications.
  • Migration – Migrate your Kubernetes applications to another Kubernetes cluster.

Migrating Kubernetes applications is a compelling use case. One of the significant benefits of using Kubernetes is the predictability of the platform and consequently the portability of applications that reside on it. With the main exception of nuances with persistent storage, the Kubernetes API will fell almost indistinguishable whether it resides on prem, GKE, AKS, EKS and elsewhere. If you have your Kubernetes-based application on one provider and want to migrate it to another or duplicate it to run elsewhere for dev/test, this can easily be achieved. Especially with Velero.


Install and Configure Velero

Velero consists primarily of the server (runs in a container) a storage location (ie S3 bucket) and the CLI.

Rather than reiterate what’s already in Velero’s existing and comprehensive documentation, the straight forward instructions are located https://heptio.github.io/velero/master/.


Demo App

To understand and get to grips with Velero I decided to write my own application. It’s a really simple application written in Golang and does the following:

  • Every 2 seconds, output the contents of /mnt/data/data.txt with a timestamp.

The pod will mount /mnt/data as a persistent volume based on the respective claim. The file it reads is “data.txt” which contains “some data”. The PV type is hostpath, which is suitable for testing in this single worker node cluster.

The overall solution is depicted below:

After deploying the application, we can validate it’s working as expected by inspecting the stdout file descriptor with kubectl logs:

Execute a backup (Note that in production this would likely be scheduled, and this backup includes everything. Ideally, you’d probably want to back up on a per namespace or app basis).

Validate the backup:

We can also see the backup residing in the previously defined S3 bucket:

Simulating a Disaster and Restoring

To simulate a disaster, I’ll simply remove my Pod, PV and PVC:

And for good measure, issue the same command previously used to extrapolate the logs:

We can use the velero restore command to pull the backup from our S3 bucket and restore our application.

Validate the restore:

Note that because the previous backup encompassed all namespaces and all resource types, Velero employs some logic to determine which objects it should restore, based on what already exists. However, my app, its namespace, PV and PVC has been restored, which we can validate with:

Closing Thoughts

Being able to mobilise a Kubernetes-based application on virtually any Kubernetes-based cluster is one of many compelling reasons to leverage this technology. Equally as important as ensuring availability and reliability of applications is to adopt a solid backup and disaster recovery solution. Velero is designed to facilitate this, and its flexibility in where to store and retrieve backups from helps with preventing lock-in with a particular solution, provider or vendor. Whether it’s on prem, Azure, Google Cloud, AWS, Digital Ocean or others, disasters do happen, downtime occurs. Being able to lift and shift entire cluster resources in a standardised is quickly becoming a solid requirement for modern applications.

Bootstrapping Prometheus, Grafana and Alertmanager to PKS deployed K8s Clusters

PKS is a comprehensive platform for the provisioning and management of Kubernetes clusters, which can be further enhanced by leveraging its extensibility options. In this post, we will modify a plan to deploy a yaml manifest file which provisions Prometheus, Grafana, and Alertmanager backed by NSX-T load balancers.

Why Prometheus, Grafana and Alertmanager?

The Cloud Native Computing Foundation accepted Prometheus as its second incubated project, the first being Kubernetes. Originally developed by SoundCloud. It has quickly become a popular platform for the monitoring of Kubernetes platforms. Built upon a powerful analytics engine, extensive and highly flexible data modeling can be accomplished with relative ease.

Grafana is, amongst other things, a visualisation tool that enables users to graph, chart, and generally visually represent data from a wide range of sources, Prometheus being one of them.

AlertManager handles alerts that are sent by applications such as Prometheus and performs a number of operations such as deduplicating, grouping and routing.

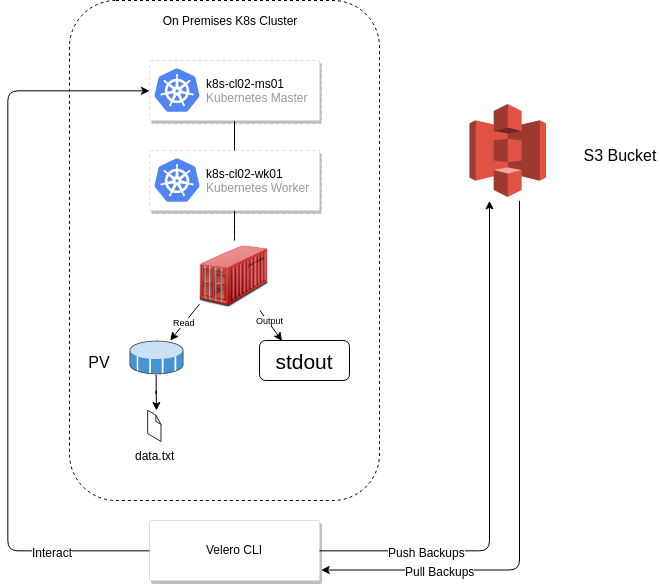
What I wanted to do, as someone unfamiliar with these tools is to devise a way to deploy these components in an automated way in which I can destroy, and recreate with ease. The topology of the solution is depicted below:


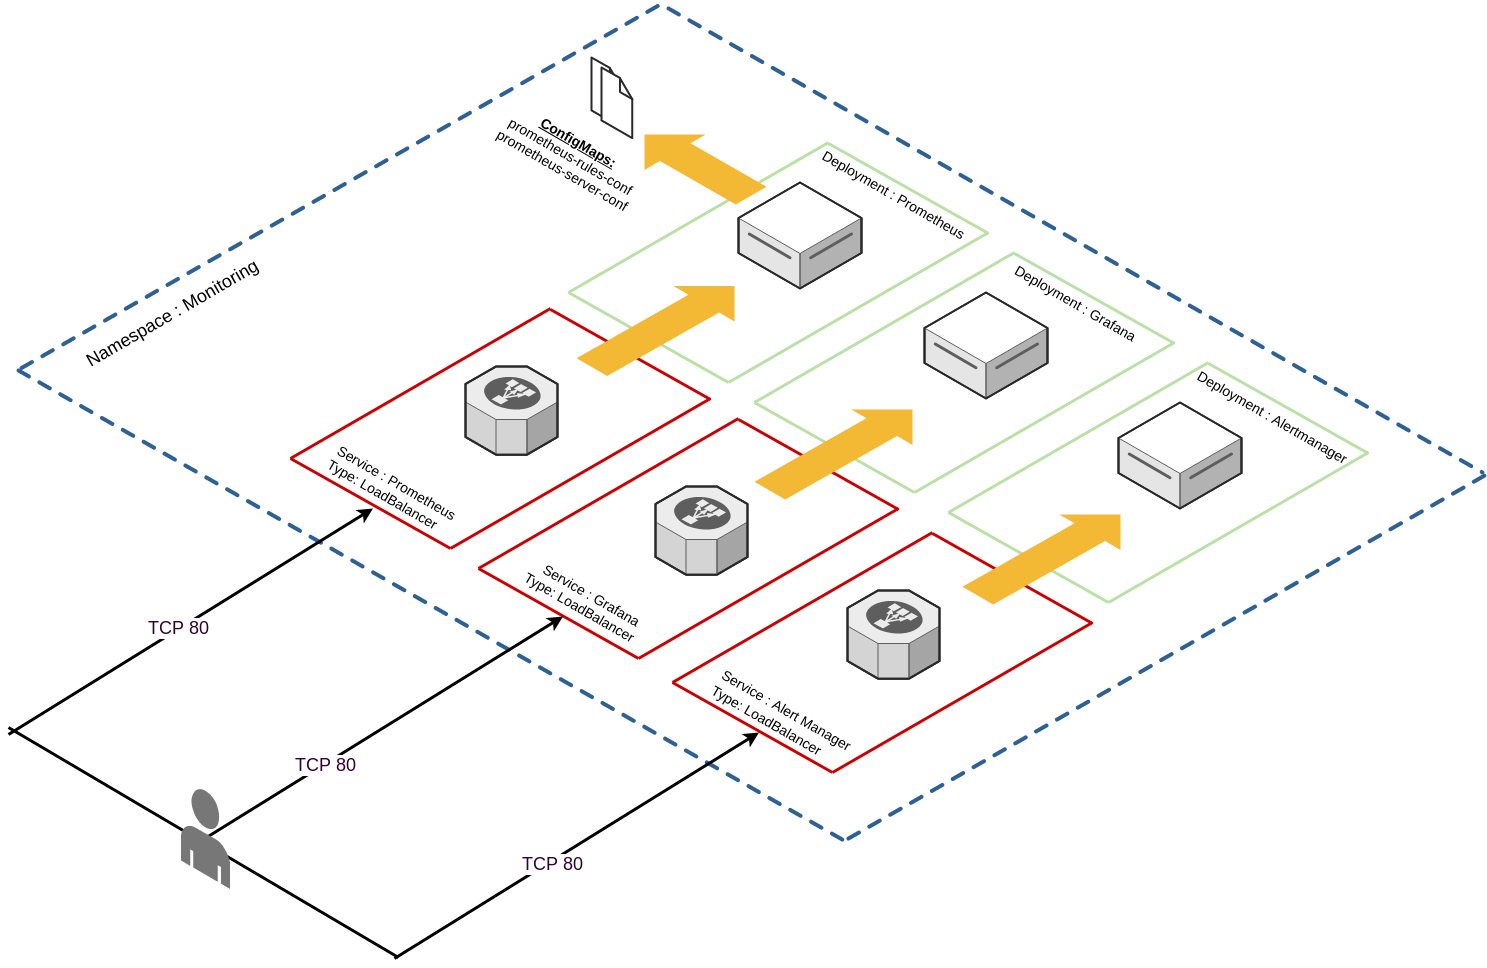
Constructing the manifest file

TLDR; I’ve placed the entire manifest file here, which creates the following:

  • Create the “monitoring” namespace.
  • Create a service account for Prometheus.
  • Create a cluster role requires for the Prometheus service account.
  • Create a cluster role binding for the Prometheus service account and the Prometheus cluster role.
  • Create a config map for Prometheus that:
    • Defines the Alertmonitor target.
    • Defines K8S master, K8S worker, and cAdvisor scrape targets.
    • Defines where to input alert rules from.
  • Create a config map for Prometheus that:
    • Provides a template for alerting rules.
  • Create a single replica deployment for Prometheus.
    • Expose this deployment via “LoadBalancer” (NSX-T).
  • Create a single replica deployment for Grafana.
    • Expose this deployment via “LoadBalancer” (NSX-T).
  • Create a single replica deployment for Alertmonitor.
    • Expose this deployment via “Loadbalancer” (NSX-T).


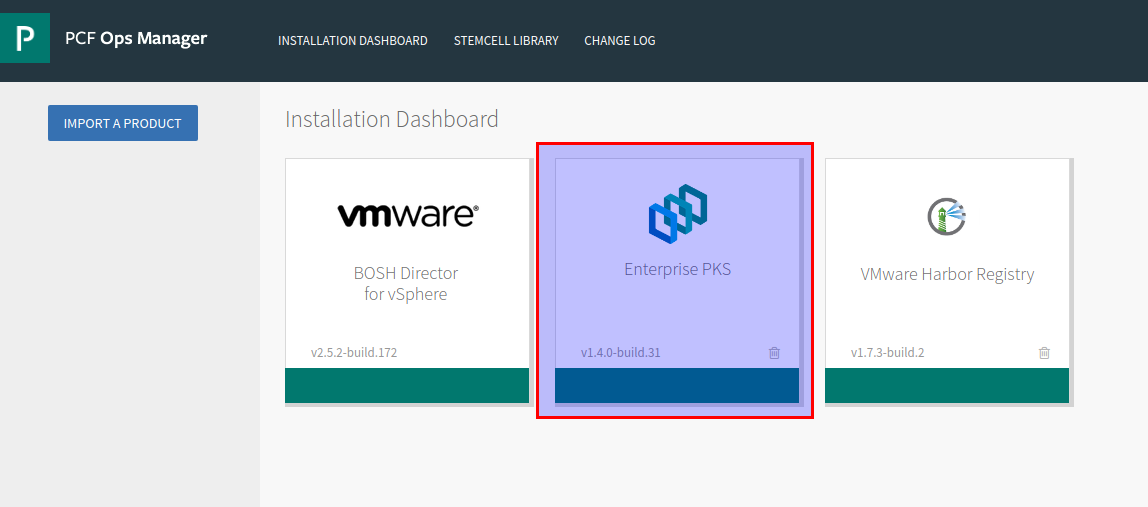
Bootstrapping the manifest file in PKS

Log into Ops manager and select the PKS tile:

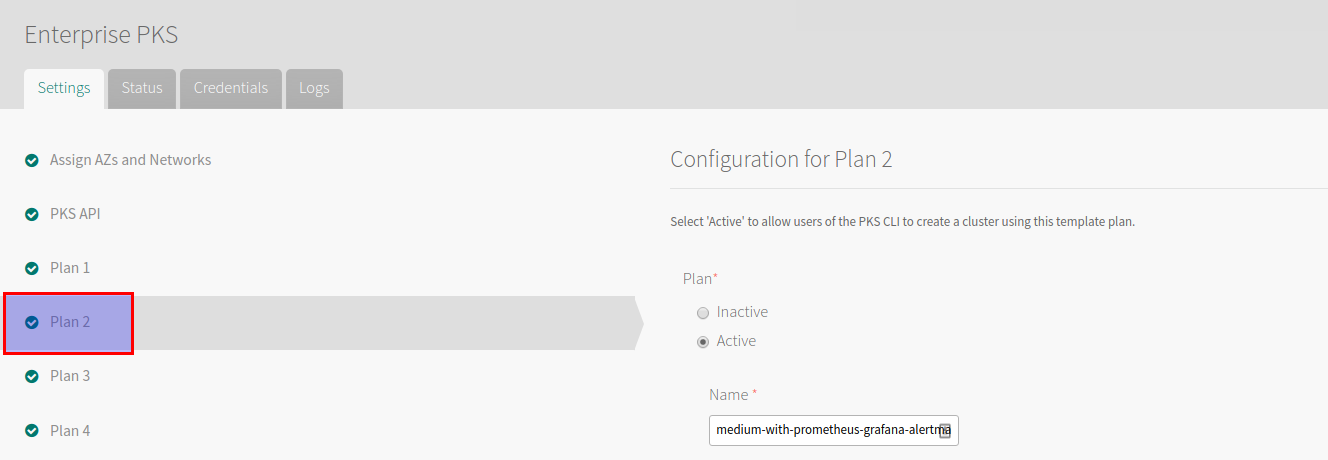
Select a plan from the left-hand side, record the plan name for later:

Scroll down and paste the aforementioned YAML file into the Add-ons section

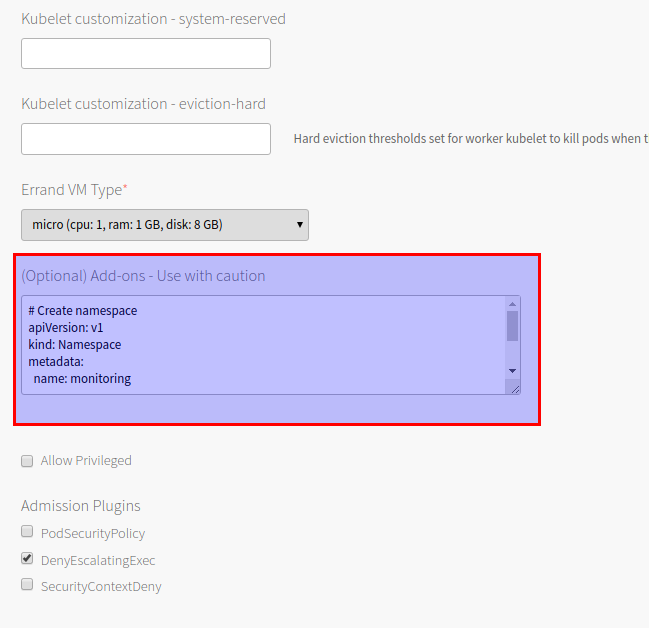
Save and then provision a cluster using the aforementioned plan:


david@mgmt-jumpbox:~$ pks create-cluster k8s --external-hostname k8s.virtualthoughts.co.uk --plan medium-with-prometheus-grafana-alertmanager --num-nodes 2

After which execute the following to acquire the list of loadbalancer IP addresses for the respective services:

david@mgmt-jumpbox:~$ kubectl get svc -n monitoring
NAME           TYPE           CLUSTER-IP       EXTERNAL-IP                 PORT(S)        AGE
alertmanager   LoadBalancer   10.100.200.218   100.64.96.5,172.16.12.129   80:31747/TCP   100m
grafana        LoadBalancer   10.100.200.89    100.64.96.5,172.16.12.128   80:31007/TCP   100m
prometheus     LoadBalancer   10.100.200.75    100.64.96.5,172.16.12.127   80:31558/TCP   100m

Prometheus – Quick tour

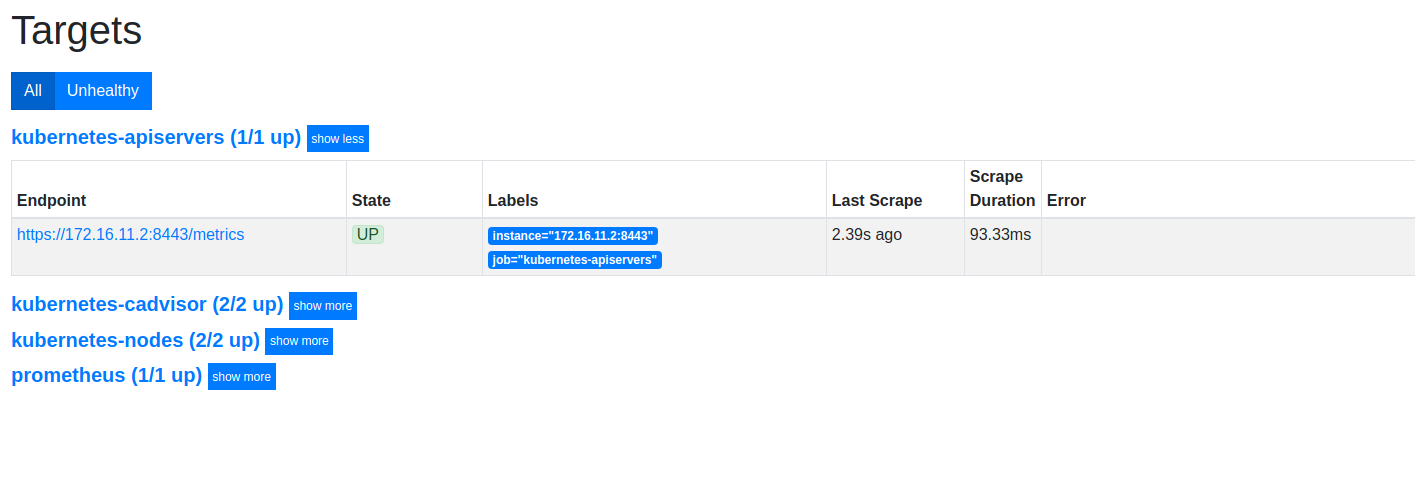
Logging into http://prometheus-lb-vip/targets will list the list of scrape targets for Prometheus, which have been configured via the respective configmap and include:

  • API server (Master)
  • Nodes (Workers)
  • cAdvisor (Pods)
  • Prometheus (self)

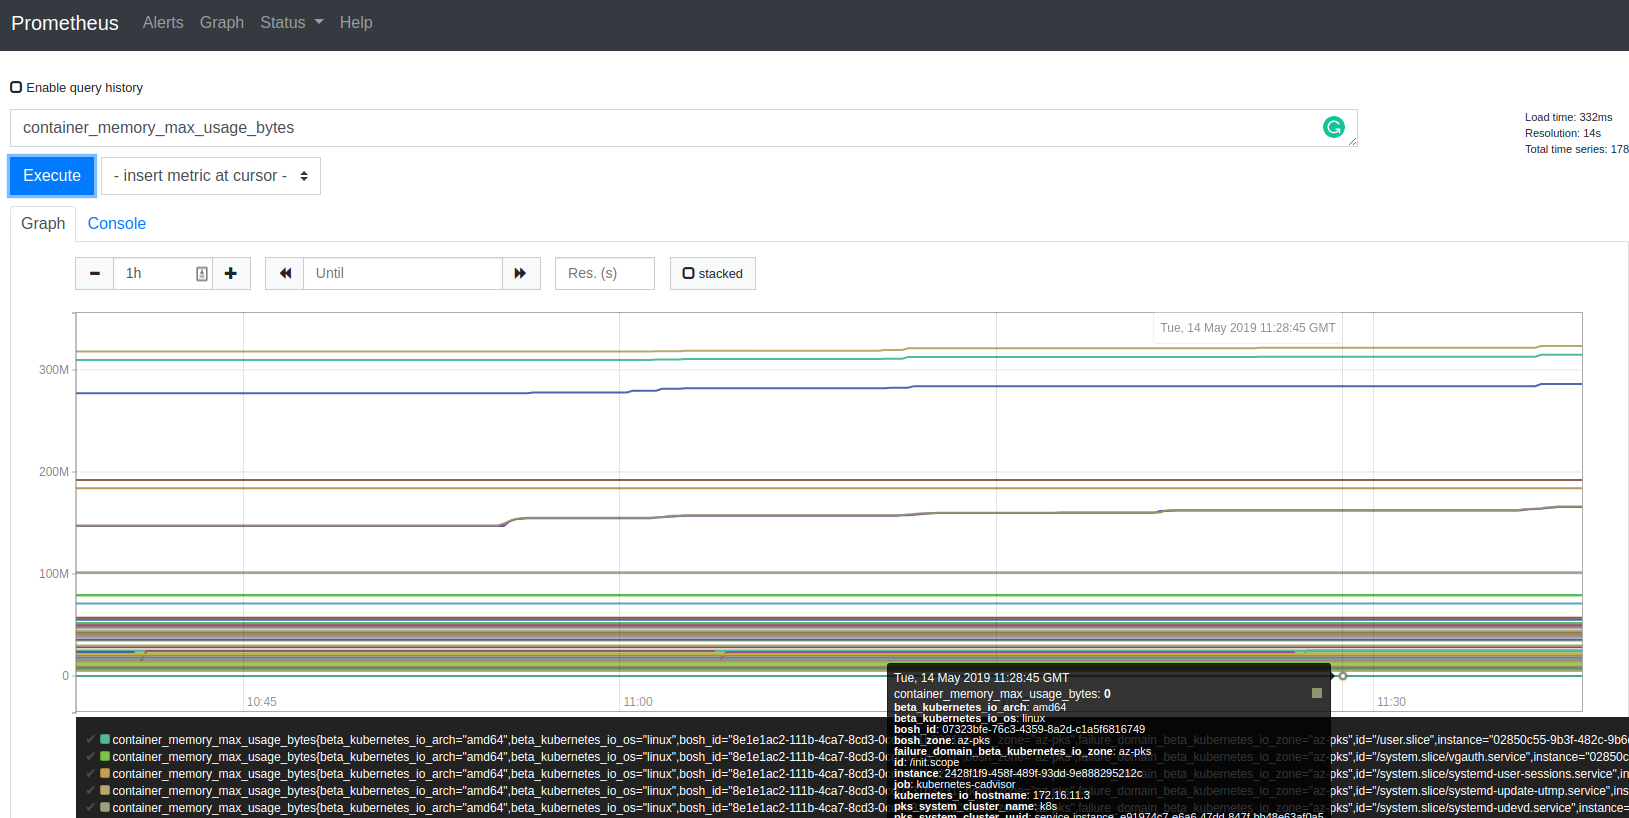
Which can be graphed / modelled / queried:


Grafana – Quick Tour

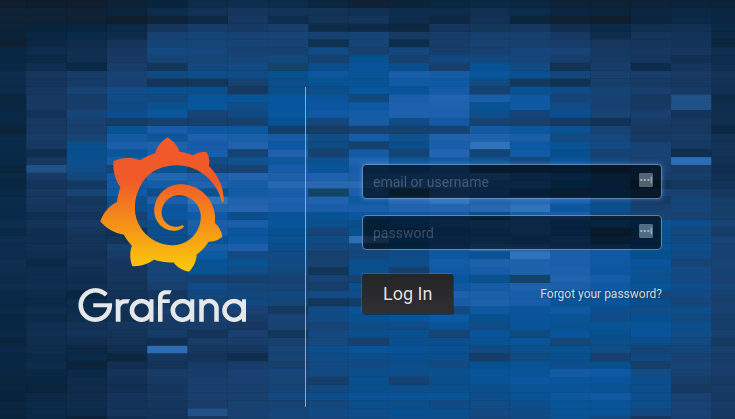
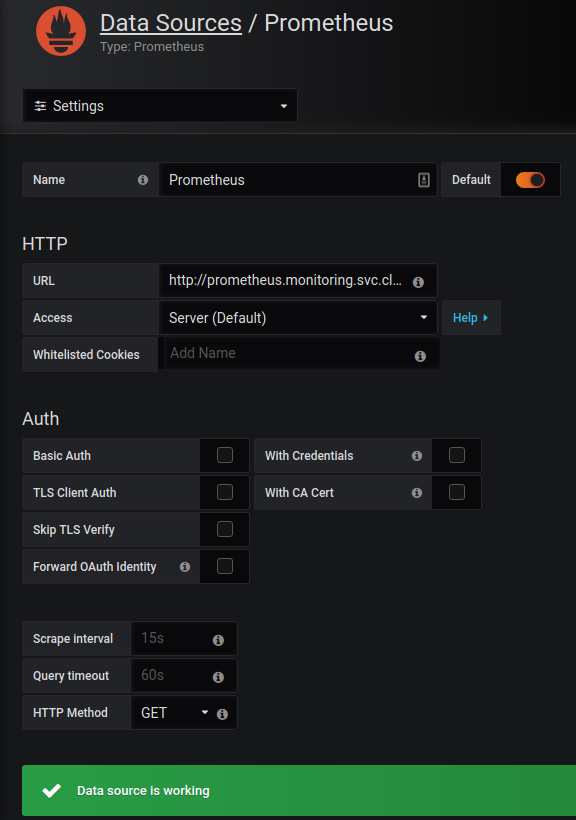
Out of the box, Grafana has very limited configuration applied – I struggled a little bit with constructing a configmap that would automatically add Prometheus as a data source, so a little bit of manual configuration is required (for now). Accessing http://grafana-lb-vip will prompt for a logon: (admin/admin) is the default
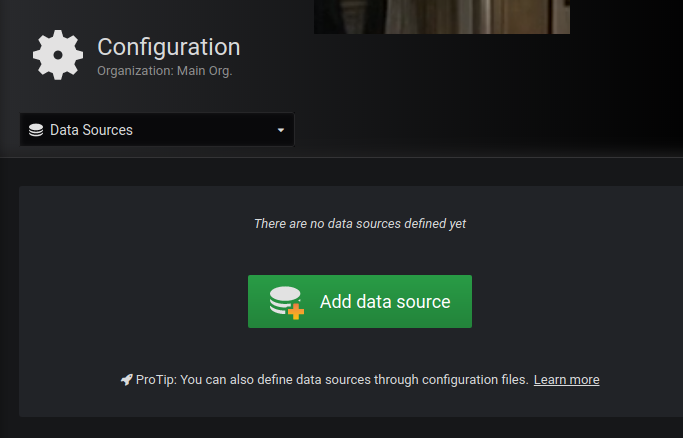
 

Add a data source:

Hint : use “prometheus.monitoring.svc.cluster.local” as the source URL

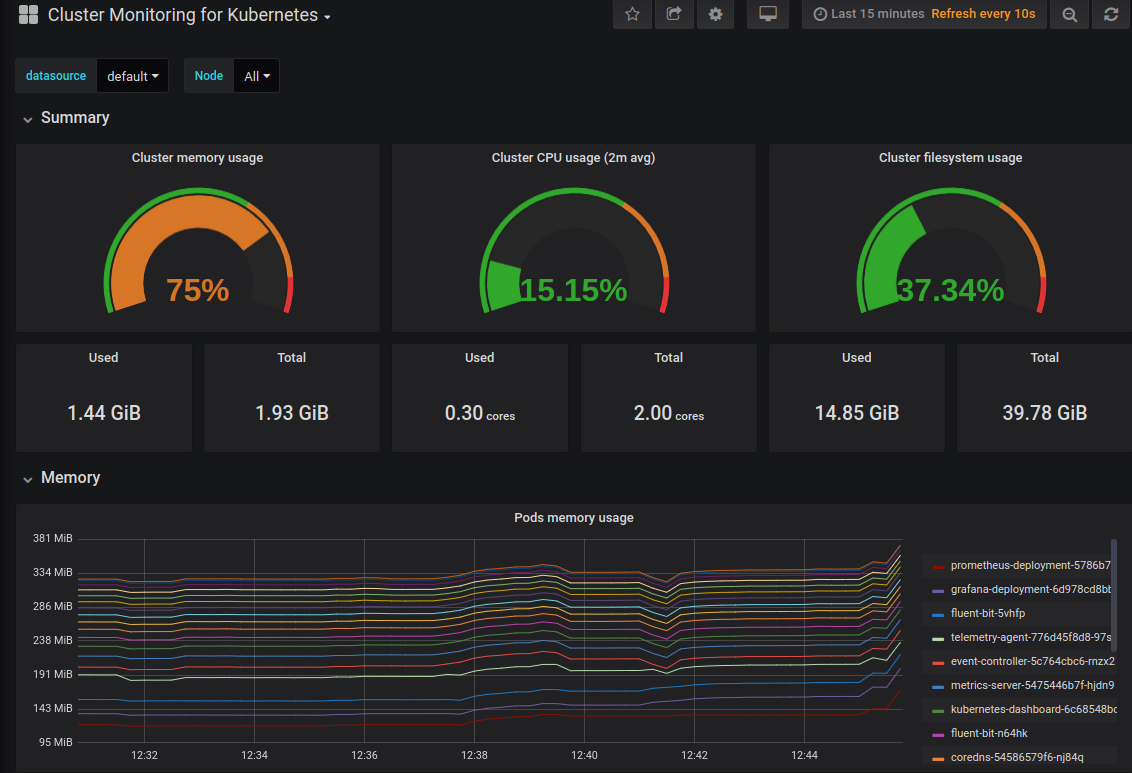
After creating a dashboard (or importing one) we can validate Grafana is extracting information from Prometheus


Alertmanager – Quick Tour

Alertmanager can be accessed via http://alertmanager-lb-vip. From the YAML manifest it has a vanilla config, but Prometheus is configured to use it as a alert target via the configmap:

  prometheus.yml: |-
    global:
      scrape_interval: 5s
      evaluation_interval: 5s
      
    alerting:
      alertmanagers:
        - static_configs:
          - targets: 
            - "alertmanager.monitoring.svc.cluster.local:80"

Alerts need to be configured in Prometheus in order for Alertmanager to ingest / deduplicate / forward etc.

As an example, I tested some integration with Discord:

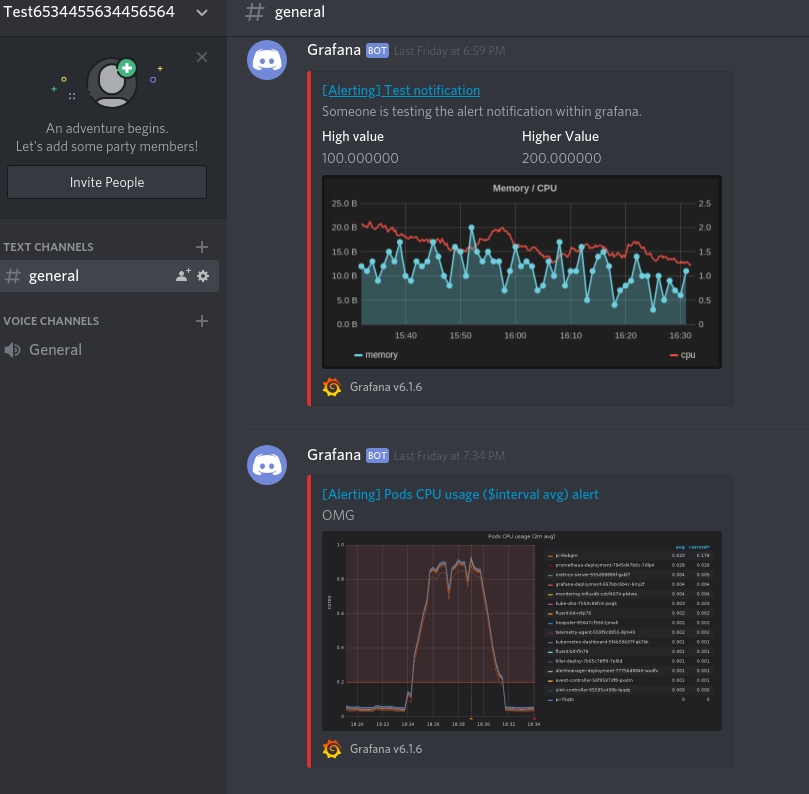
Practical to send alerts to a Discord sever? Probably not.

Fun? Yes!

CKA Exam Experience (Inc study & lab guide)

Introduction

Over the long bank holiday weekend, I sat and passed the Certified Kubernetes Exam (CKA). This blog post goes over my experience (With respect to the NDA) together with a lab guide I’ve made which I’ve uploaded hoping it might help others.


Format

The online exams consist of a set of performance-based items (problems) to be solved on the command line. For the CKA there are 24 questions of varying difficulty. At the time of writing, the only option to sit this exam is through remote proctoring.

This link contains the most pertinent information to assimilate.


Experience

I’m a huge fan of practical exams. I’m so glad the powers at be decided to go down this route. I absolutely loathe multiple choice exams for many reasons. The remote proctoring was a new experience for me, and I wasn’t completely comfortable with it. Given the choice, I would have preferred to go to a test center. I hope The Linux Foundation adds this option in the future.

I sat the exam first time around feeling relatively confident, but knew I had some weaker areas. After a painstaking wait I received the following email:

confused oh no GIF by It's Always Sunny in Philadelphia

I brushed myself off, crammed the areas I was weaker on, took the exam again and waited….

…and waited

From my experience, as a techie, I get a much more accomplished feeling when passing practical exams, such as this / VCAP’s etc. Either way, to say I was happy would be a gross understatement.


Takeaways

  • A lot of people say this exam is “hard”. I get really discouraged reading up on peoples exam experiences saying exams are “hard”. I would say a more accurate adjective for this exam would be “Fair”. Know the curriculum, practice your craft, and you’ll get there.
  • Lean on the documentation as much as you need to. You have access to kubernetes.io/docs during the exam.
  • It’s a practical exam, so practice, practice, and practice some more.
  • You get a free retake, so don’t worry if you don’t pass first time.
  • kubectl run somedeployment –image=nginx –replicas=5 –dry-run -o yaml. Output existing or new objects to a yaml file if you need to make finer adjustments or create objects from scratch.


Lab Guide

My revision approach for this exam predominantly consisted of:

  1. Reading up on the topics
  2. Apply the knowledge to practical examples
  3. Validate the approach

I ended up with three documents:

  • Revision Notes
  • Practice lab exercises
  • Practice lab exercises answers (writing this helped me commit this information to memory)


All of which can be found at https://github.com/David-VTUK/CKA-StudyGuide


« Older posts Newer posts »

© 2025 Virtual Thoughts

Theme by Anders NorenUp ↑

Social media & sharing icons powered by UltimatelySocial
RSS
Twitter
Visit Us
Follow Me