Virtualisation, Storage and various other ramblings.

Category: eBPF

Kubernetes on RK1 / Turing Pi 2: Automation with Ansible, Cilium and Cert-Manager

TLDR: Take me to the Playbook

Note – This is just a high-level overview, I’ll likely follow up with a post dedicated on the CIlium/BGP configuration.
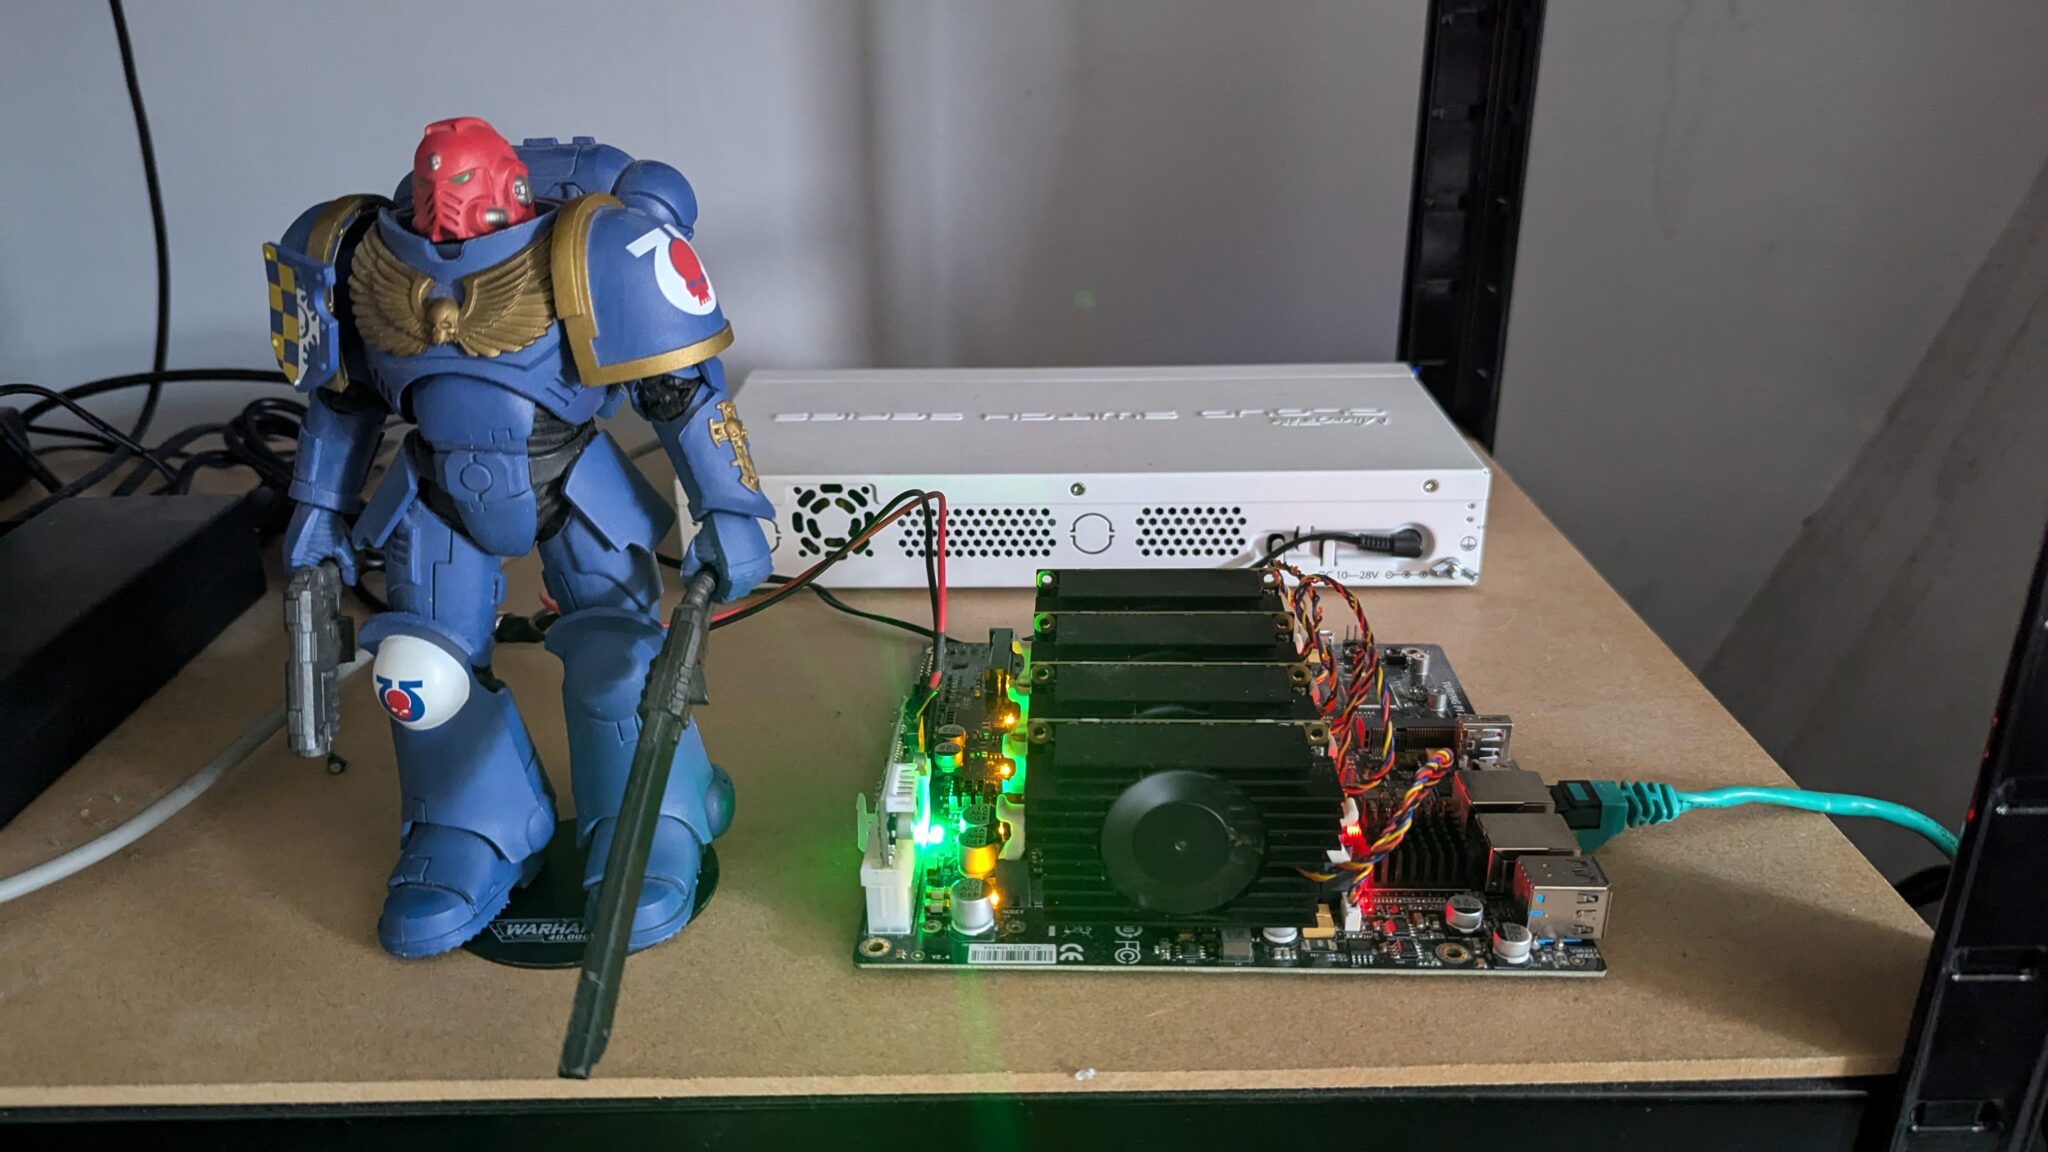
I’ve had my Turing Pi 2 board for a while now, and during that time I’ve struggled to decide which automation tooling to use to bootstrap K3s to it. However, I reached a decision to use Ansible. It’s not something I’m overly familiar with, but this would provide a good opportunity to learn by doing.

The idea is pretty straightforward:
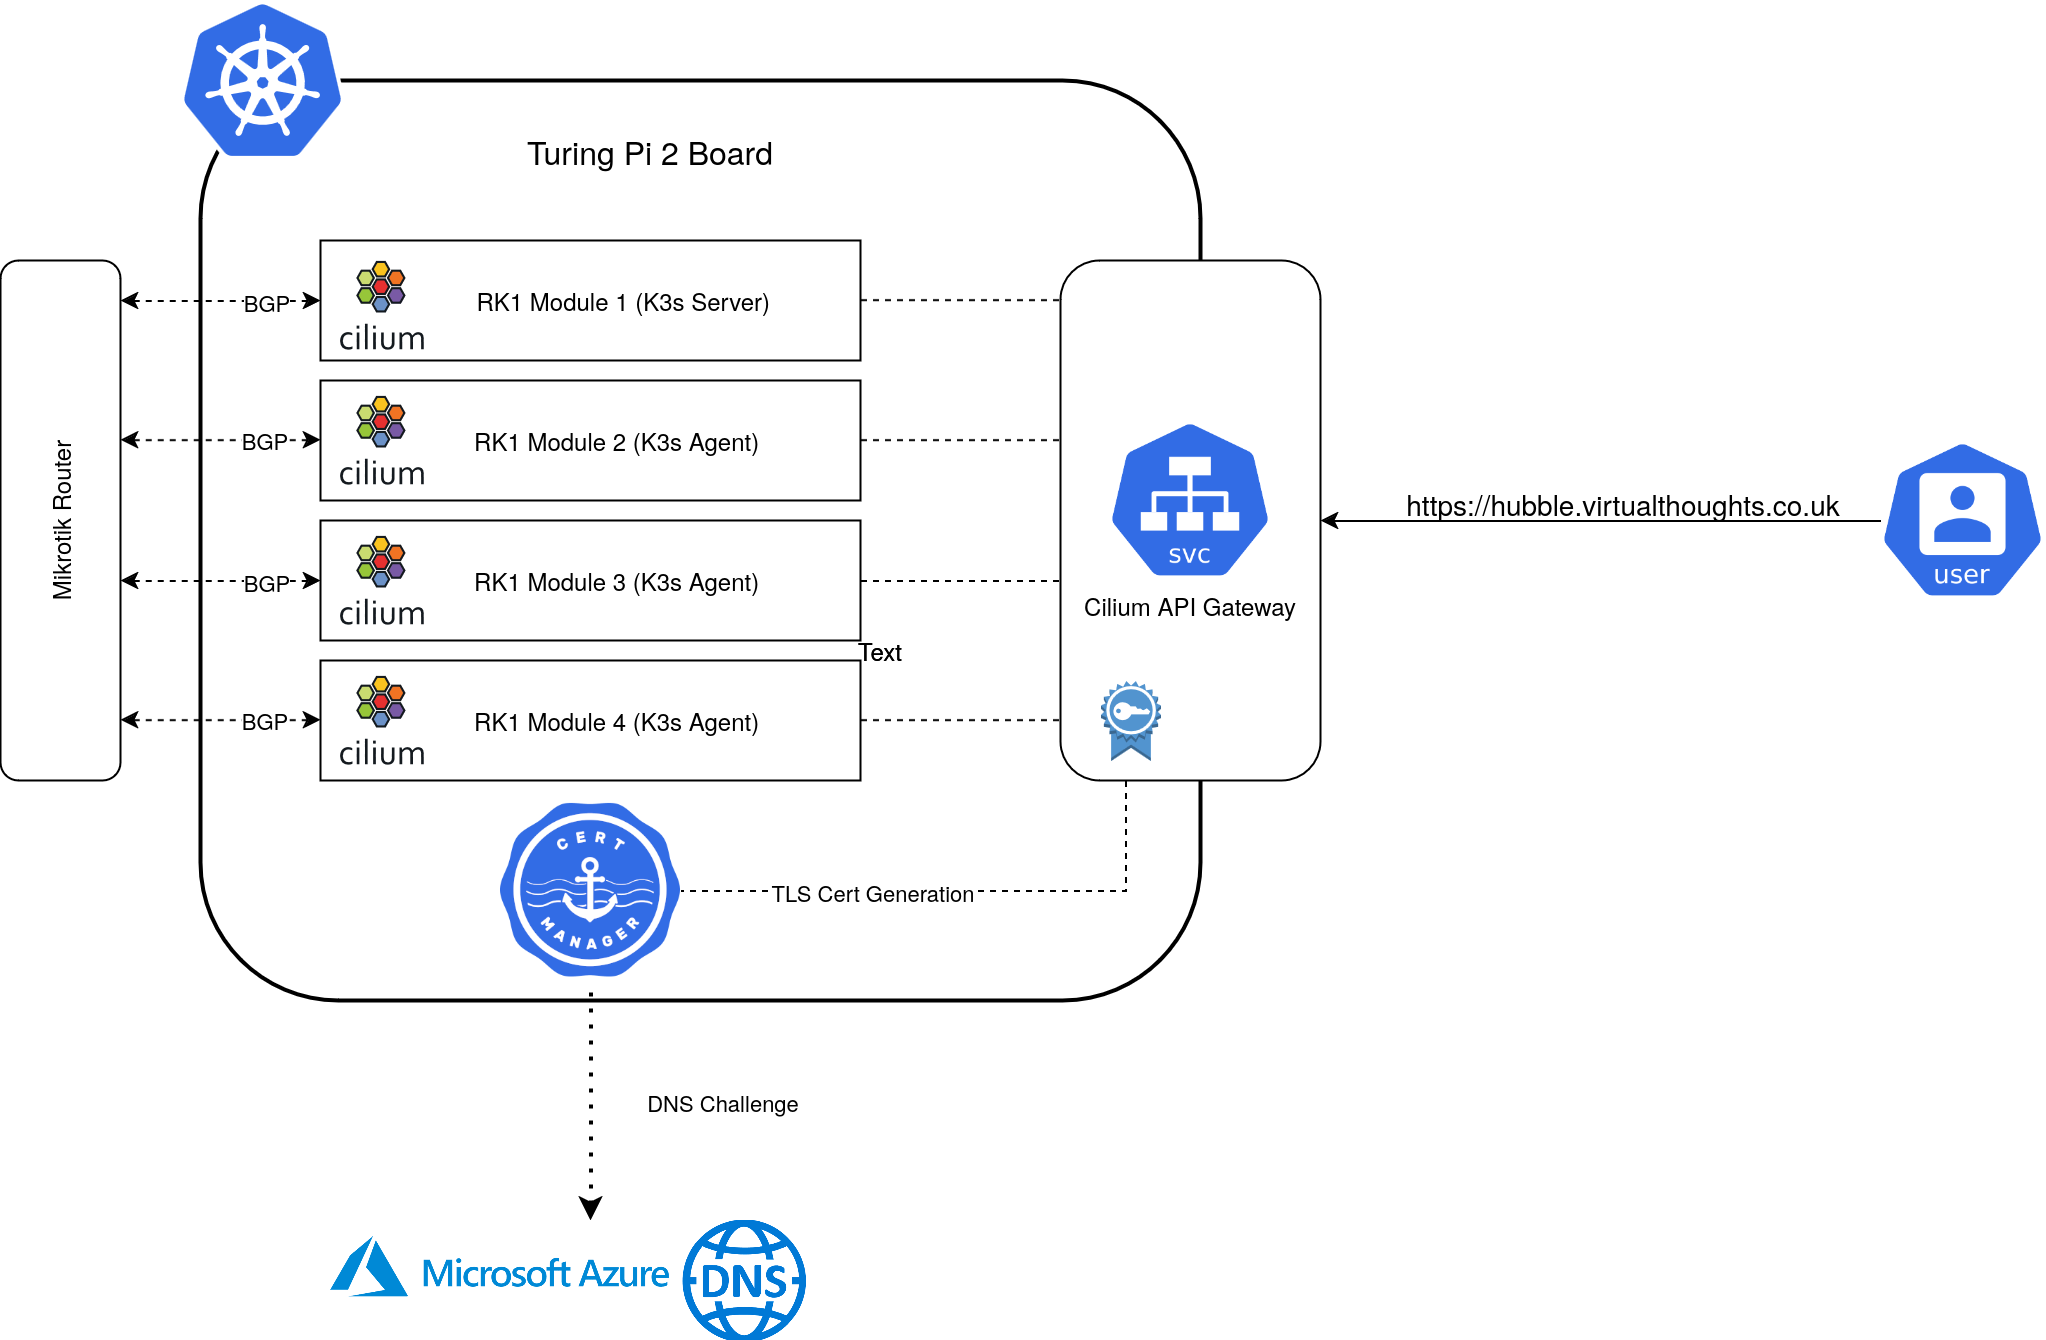
Each RK1 module is fairly well equipped:

  • 32GB Ram
  • 8 Core CPU
  • 512GB NVME SSD
  • Pre-Installed with Ubuntu

Mikrotik Config

Prior to standing up the cluster, the Mikrotik router can be pre-configured to peer with each of the RK1 Nodes, as I did:

routing/bgp/connection/ add address-families=ip as=64512 disabled=no local.role=ibgp name=srv-rk1-01 output.default-originate=always remote.address=172.16.10.221 routing-table=main

routing/bgp/connection/ add address-families=ip as=64512 disabled=no local.role=ibgp name=srv-rk1-02 output.default-originate=always remote.address=172.16.10.222 routing-table=main

routing/bgp/connection/ add address-families=ip as=64512 disabled=no local.role=ibgp name=srv-rk1-03 output.default-originate=always remote.address=172.16.10.223 routing-table=main

routing/bgp/connection/ add address-families=ip as=64512 disabled=no local.role=ibgp name=srv-rk1-04 output.default-originate=always remote.address=172.16.10.224 routing-table=main

Workflow

The following represents an overview of the steps code repo
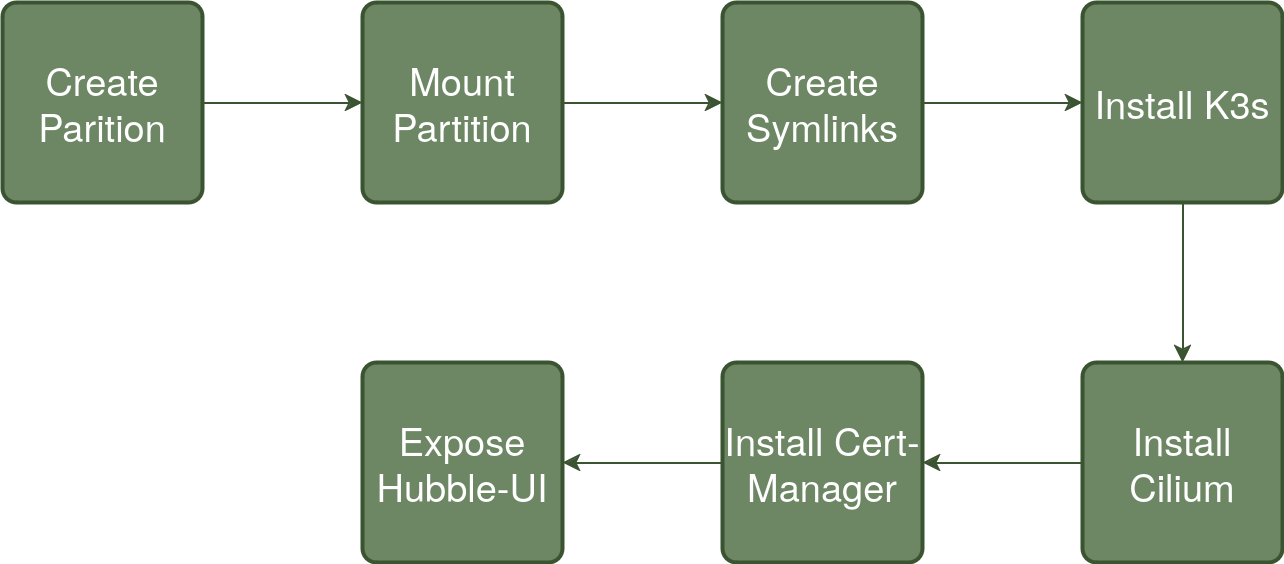
To summarise each step:

Create Partition

Each of my RK1 Modules has a dedicated 512GB NVME drive – This will be used for primary Kubernetes storage as well as container storage. The drive is presented as a raw block device and therefore needs partitioning before mounting.

Mount Partition

The created partition is mounted to /mnt/data and checked.

Create Symlinks

Three directories are primarily used by K3s/Containerd to store data. Symlinks are created so their contents effectively reside on the NVME drive. These are:

/run/k3s -> /mnt/data/k3s
/var/lib/kubelet -> /mnt/data/k3s-kubelet
/var/lib/rancher -> /mnt/data/k3s-rancher

Install K3s

To facilitate replacing both Kube-Proxy and the default CNI to Cilium’s equivalents, a number of flags are passed to the Server install script:

--flannel-backend=none
--disable-network-policy
--write-kubeconfig-mode 644
--disable servicelb
--token {{ k3s_token }}
--disable-cloud-controller
--disable local-storage
--disable-kube-proxy
--disable traefik

In addition, the GatewayAPI CRD’s are installed:

- name: Apply gateway API CRDs
  kubernetes.core.k8s:
    state: present
    src: https://github.com/kubernetes-sigs/gateway-api/releases/download/v1.1.0/experimental-install.yaml

Install Cilium

Cilium is is customised with the following options enabled:

  • BGP Control Plane
  • Hubble (Relay and UI)
  • GatewayAPI
  • BGP configuration to Peer with my Mikrotik router

Install Cert-Manager

Cert-Manager facilitates certificate generation for exposed services. In my environment, the API Gateway is annotated in a way that Cert-Manager will automatically generate a TLS Certificate for, using DNS challenges to Azure DNS.

This also includes the required clusterIssuer resource that provides configuration and authentication details

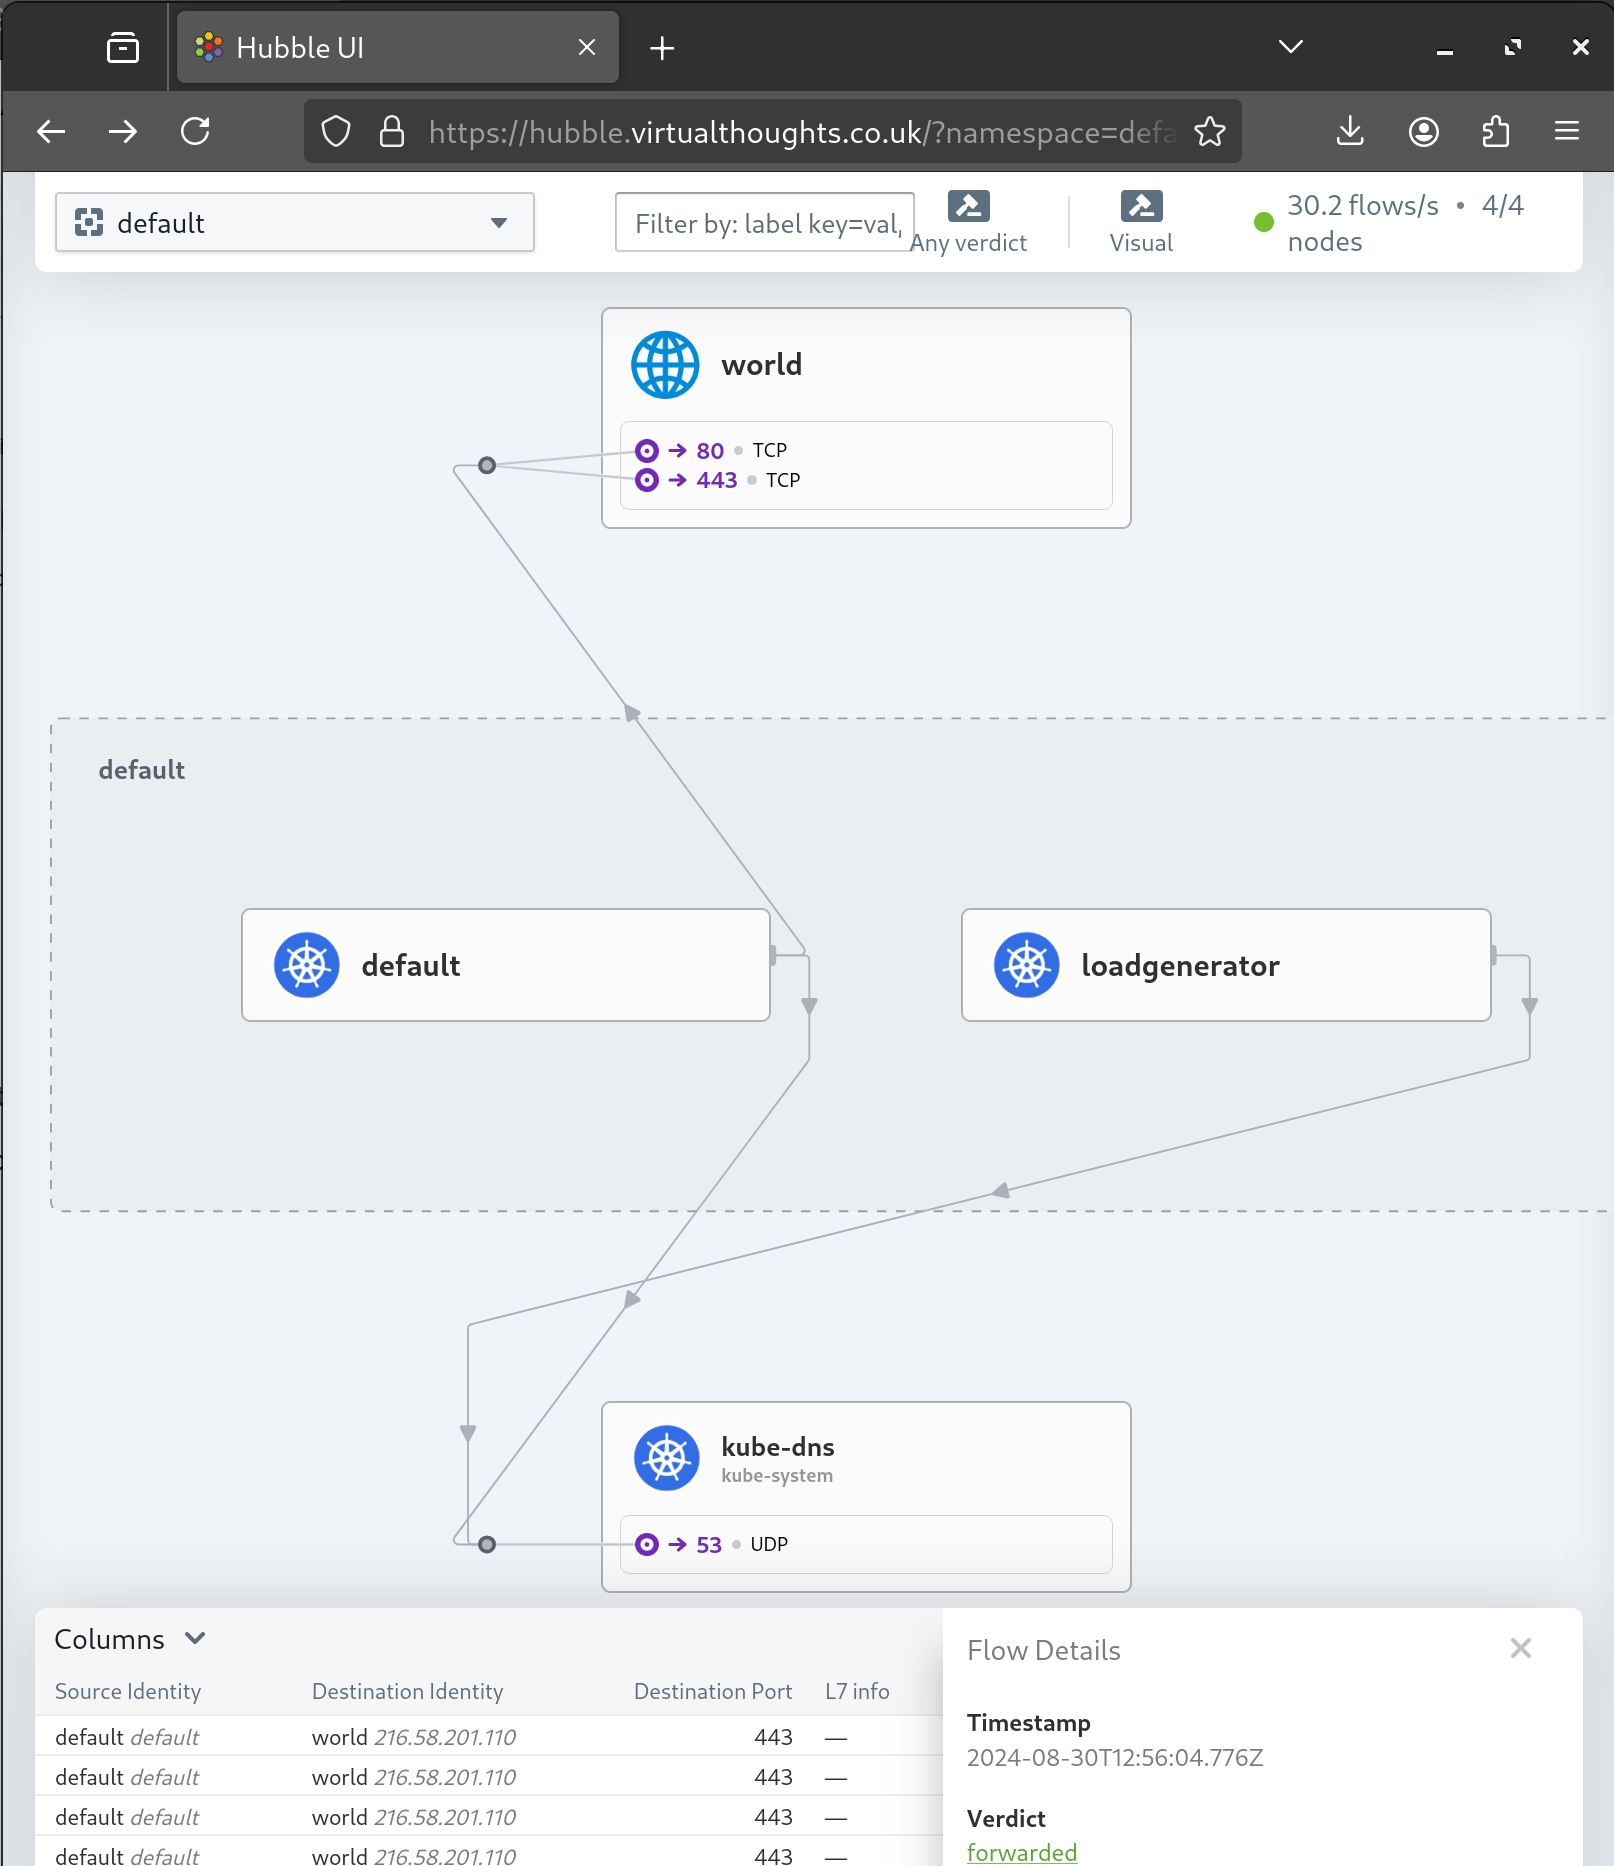
Expose Hubble-UI

A gateway and httproute resource is created to expose the Hubble UI:
Mikrotik BGP Peering Check

Using Winbox, the BGP peering and route propagation can be checked:
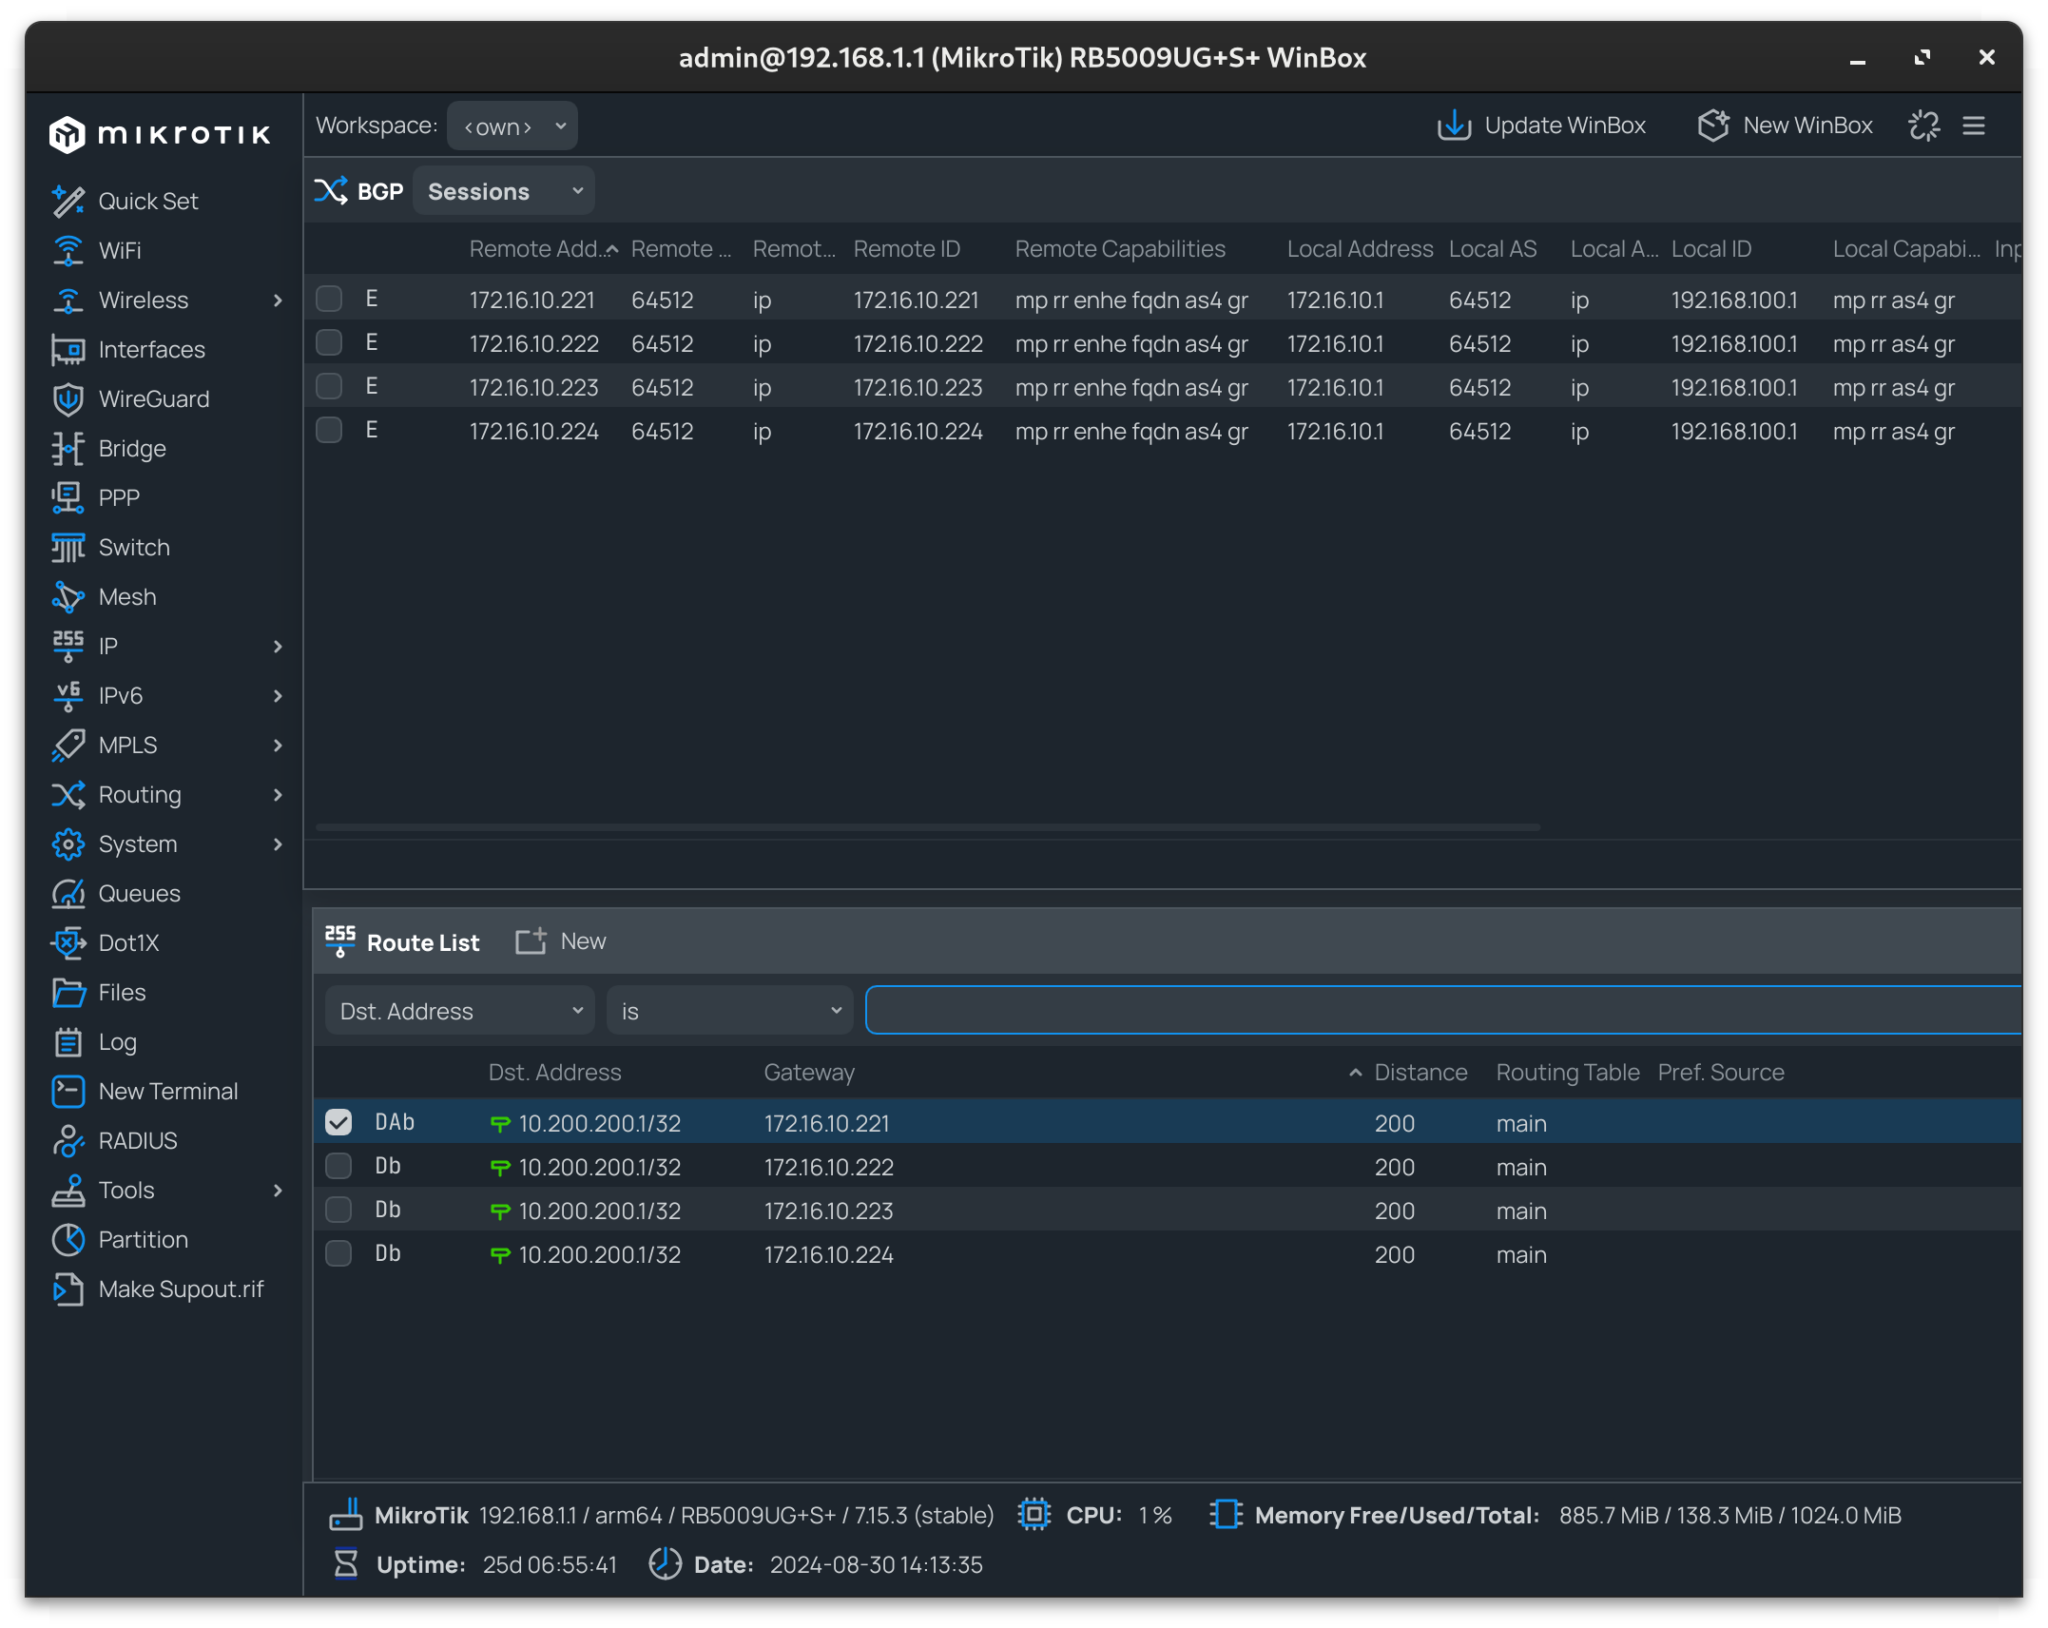
In my instance, 10.200.200.1 resolves to my API Gateway IP, with each node advertising this address.
eBPF + Grafana Live for Metric Streaming

Code Repo for this post can be found here.

Grafana Live is a real-time messaging engine built into Grafana v8 and onwards, designed to support real-time data streaming and updates. It allows data to be pushed to objects such as dashboard panels directly from the source. One of the benefits being near instant updates and no need to perform periodic refreshes.

Having experimented with eBPF recently, I thought this would be a neat thing to pair up – High performance packet analysis provided by Express Data Path (XDP), with instant visualisation provided by Grafana

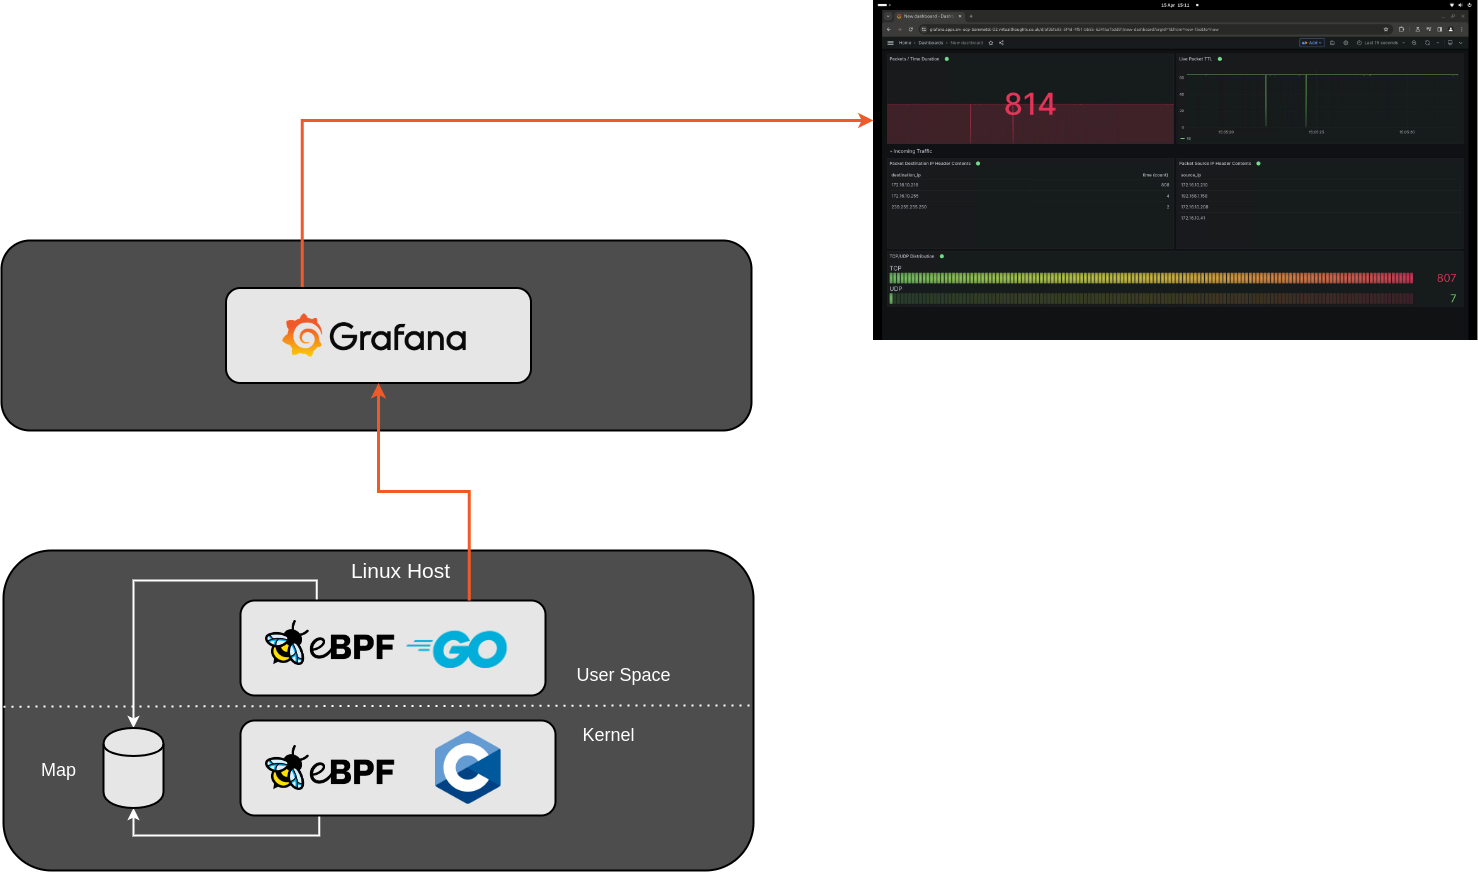
The app consists of two parts – the C-based eBPF application that hooks into XDP, and a Go based application running in User space. The two share information by leveraging an eBPF map, in this example a Ring Buffer.

The eBPF C application is written in such a way to extract key information from incoming packets, and store them into a struct. You could simply pass each packet as-is, but I wanted some practice navigating through different layers and working my way up the OSI model:

struct packetDetails
{
    unsigned char l2_src_addr[6];
    unsigned char l2_dst_addr[6];
    unsigned int l3_src_addr;
    unsigned int l3_dst_addr;
    unsigned int l3_protocol;
    unsigned int l3_length;
    unsigned int l3_ttl;
    unsigned int l3_version;
    unsigned int l4_src_port;
    unsigned int l4_dst_port;
};

In the Go app, this information is received and formatted before it’s sent over to Grafana, including doing some convenient translating to format certain fields like MAC addresses (DEC->HEX) and IP addresses (DEC->String)

	//Convert MAC address from Decimal to HEX
	sourceMacAddress := fmt.Sprintf("%02x:%02x:%02x:%02x:%02x:%02x", packet.L2_src_addr[0], packet.L2_src_addr[1], packet.L2_src_addr[2], packet.L2_src_addr[3], packet.L2_src_addr[4], packet.L2_src_addr[5])
	destinationMacAddress := fmt.Sprintf("%02x:%02x:%02x:%02x:%02x:%02x", packet.L2_dst_addr[0], packet.L2_dst_addr[1], packet.L2_dst_addr[2], packet.L2_dst_addr[3], packet.L2_dst_addr[4], packet.L2_dst_addr[5])

	//Convert IP address from Decimal to IPv4
	sourceIP := net.IPv4(byte(packet.L3_src_addr), byte(packet.L3_src_addr>>8), byte(packet.L3_src_addr>>16), byte(packet.L3_src_addr>>24)).String()
	destIP := net.IPv4(byte(packet.L3_dst_addr), byte(packet.L3_dst_addr>>8), byte(packet.L3_dst_addr>>16), byte(packet.L3_dst_addr>>24)).String()

	//Convert Protocol number to name
	protocolName := netprotocols.Translate(int(packet.L3_protocol))

And employs a simple HTTP call to send this to Grafana:

	//http post to grafana
	req, err := http.NewRequest("POST", grafanaURL, strings.NewReader(telegrafMessage))
	if err != nil {
		log.Printf("Failed to create HTTP request: %v", err)
		return err
	}

	// Add bearer token to the request header
	req.Header.Set("Authorization", "Bearer "+grafanaToken)

	resp, err := http.DefaultClient.Do(req)
	if err != nil {
		log.Printf("Failed to send HTTP request: %v", err)
		return err
	}

The Dashboard looks like then when receiving information:

New Packet, who dis?

As I was testing I noticed some “interesting” traffic being received by my test host, From the video it shows a number of destination IP’s extracted from IP packets:

  • 172.16.10.216 – Sure, expected, this is the IP address of the host I’m running the app on.
  • 172.16.10.255 – Again, sure, that’s the broadcast address for that VLAN (172.16.10.0/24)
  • 239.255.255.250 – Wait, What?

Initially, I thought something was wrong in my code, so I got my Go app to write out the packet details:

packet_details source_mac="00:11:32:e5:79:5c",destination_mac="01:00:5e:7f:ff:fa",source_ip="172.16.10.208",destination_ip="239.255.255.250",protocol="UDP",length=129i,ttl=1i,version=4i,source_port=50085i,destination_port=1900i

This was actually correct – Turns out my NAS (172.16.10.208) was sending out UPnP/SSDP Multicast traffic that my host was understandably receiving. Probably the latter as it’s hosting SMB shares. Pretty cool.

It was also why I was seeing some big dips in the live TTL packet feed. These multicast packets have a very low TTL (ie 1). Which makes sense.

© 2024 Virtual Thoughts

Theme by Anders NorenUp ↑

Social media & sharing icons powered by UltimatelySocial
RSS
Twitter
Visit Us
Follow Me