Virtualisation, Storage and various other ramblings.

Category: Cloud (Page 6 of 9)

Step by Step – Istio up and running

Service Mesh is a pretty hot topic in the Kubernetes ecosystem currently, and I wanted to get it up and running in my own lab environment. Istio’s documentation has a pre-baked solution to demonstrate some of its capabilities (a book app, if memory serves me correctly), but I wanted to deploy my own app to get more “hands-on” experience with the tech, even if it’s only very basic to start with.

Install Istio

There are a number of prerequisite steps that need to be satisfied prior to installing Istio. These are specific to my environment,  others may differ.

Install the Helm client

 sudo snap install helm --classic 

Grab Istio (1.2.0 in this example)

curl -L https://git.io/getLatestIstio | ISTIO_VERSION=1.2.0 sh - cd istio-1.2.0/

Create the Helm service account (named “tiller”)

kubectl apply -f install/kubernetes/helm/helm-service-account.yaml

Initialise Helm  using the service account specified in the previous step

helm init --service-account tiller

Create a namespace to accommodate the Istio components

kubectl create ns istio-system

Initialise Istio into the aforementioned namespace:

helm install install/kubernetes/helm/istio-init --name istio-init --namespace istio-system

Monitor the state of the pods – it will take some time for the pods to finish – these create the CRD’s required for Istio

kubectl get pods -n istio-system
NAME                      READY   STATUS              RESTARTS   AGE
istio-init-crd-10-t82m6   0/1     ContainerCreating   0          95s
istio-init-crd-11-42622   0/1     ContainerCreating   0          95s
istio-init-crd-12-65m5v   0/1     ContainerCreating   0          95s

Install Istio into the aforementioned namespace

helm install install/kubernetes/helm/istio --name istio --namespace istio-system

Configure a namespace for automatic sidecar injection

By this point, we have the internal foundations for Istio, but we’re not leveraging it. One of the fundamental workings of Istio is the use of pod sidecars. Sidecars act as the data plane, facilitating a lot of the features we want to leverage from Istio.

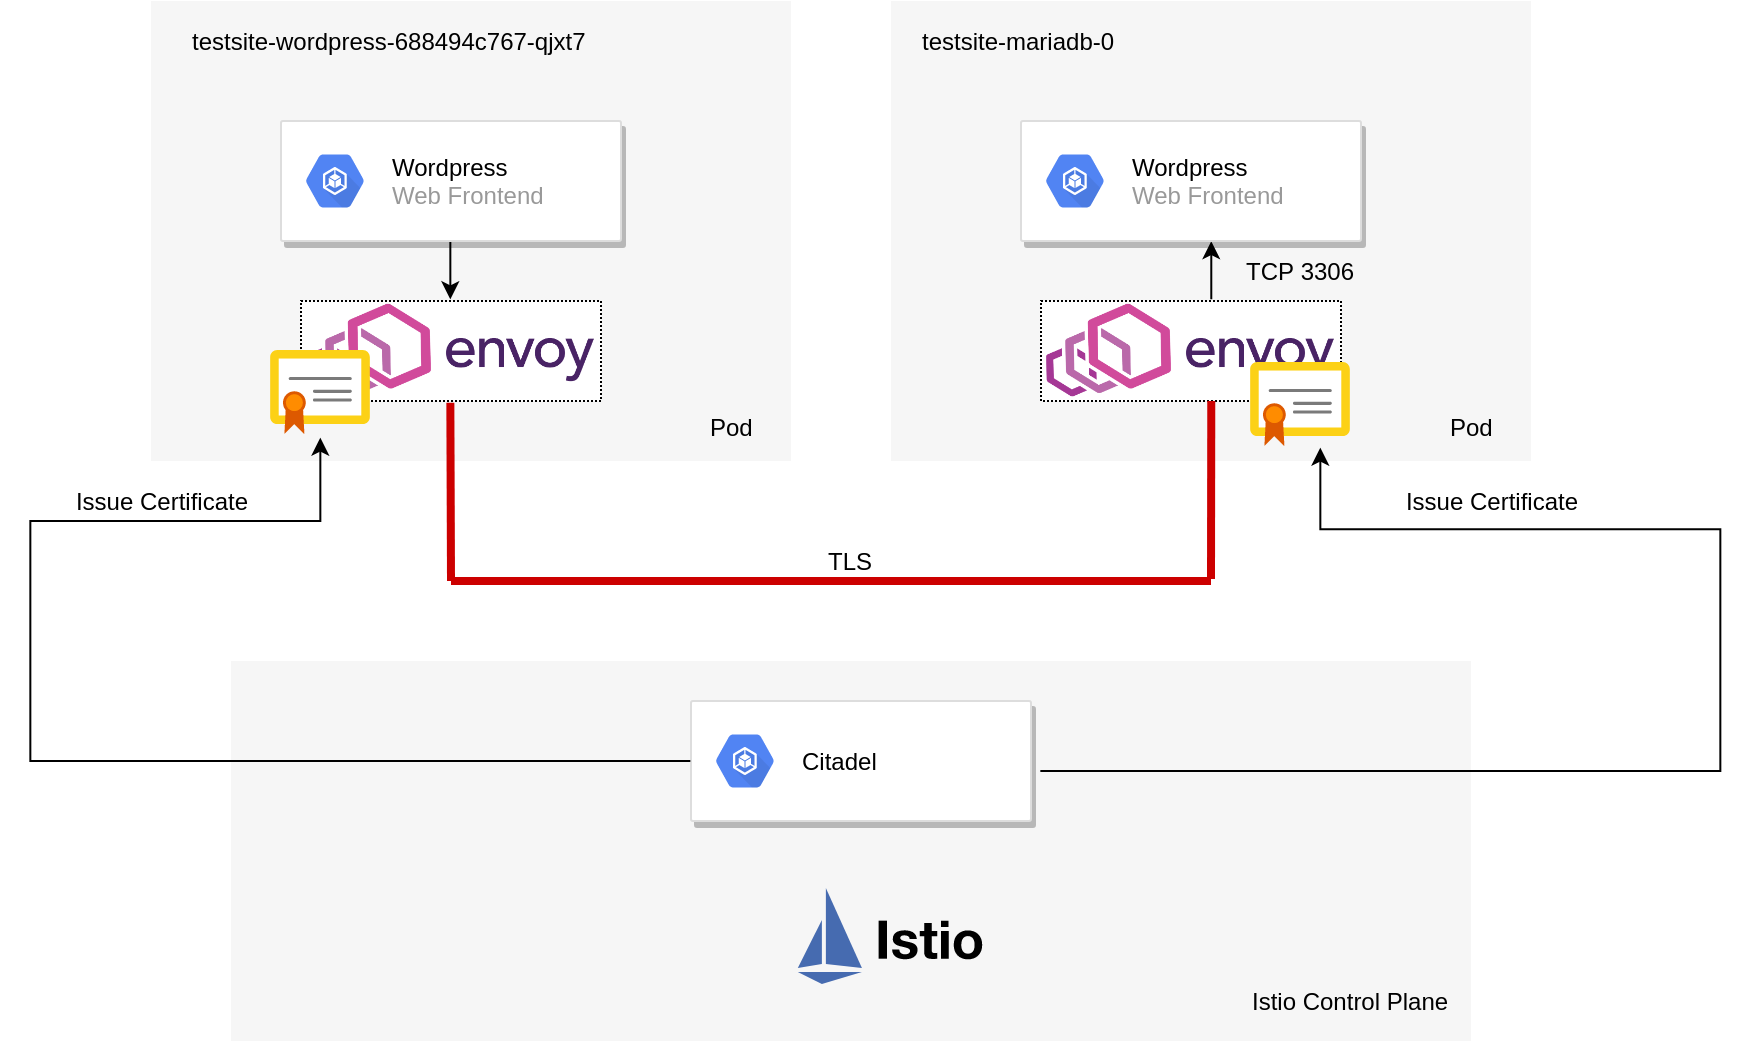
The overall architecture of an Istio-based application.

Istio doesn’t do this automatically, out of the box for all pods deployed into an environment, but Istio will inject sidecars into pods deployed into namespaces that have the istio-injection=enabled label set.

kubectl create ns app-with-injection
namespace/app-with-injection created
kubectl label namespace app-with-injection istio-injection=enabled
namespace/app-with-injection labeled

We can validate this by creating a pod into this namespace:

kubectl run nginx -n app-with-injection --image nginx

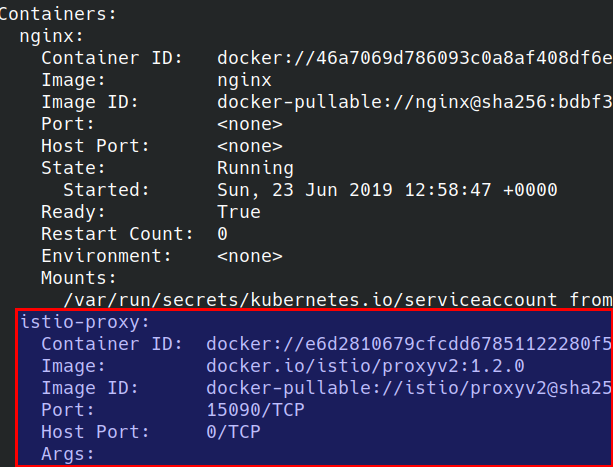
And checking the Pod contents (notice how this pod has two containers)

kubectl get pods -n app-with-injection
NAME                     READY   STATUS    RESTARTS   AGE
nginx-7cdbd8cdc9-96mbz   2/2     Running   0          52s

The proxy sidecar:


Environment Anatomy

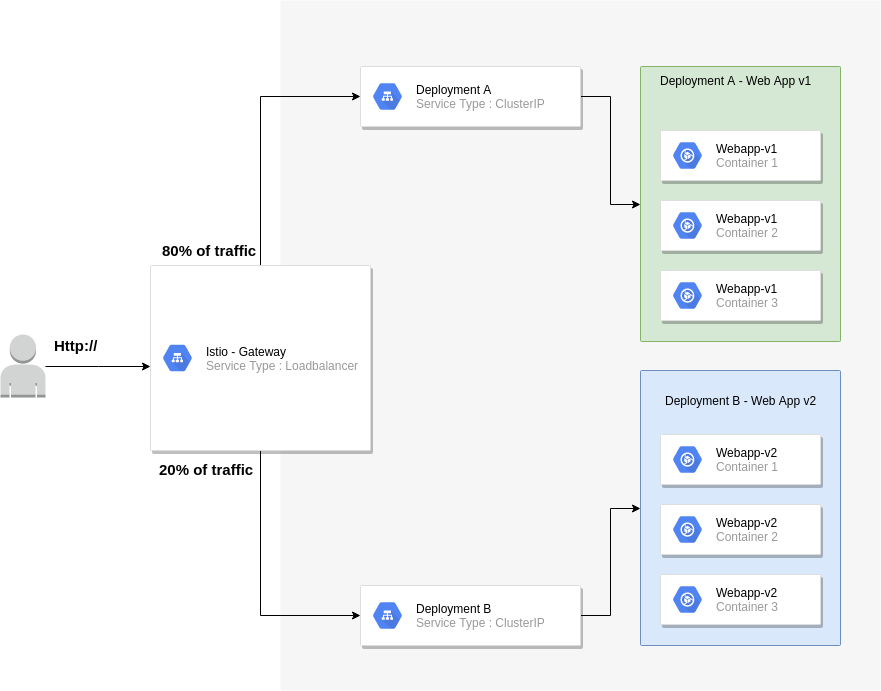
The diagram below shows how my test environment is set up


Key considerations:

The Istio gateway will reside on the edge
80% of all traffic will be routed to v1 of my web application
20% of all traffic will be routed to v2 of my web application

The application manifest can be found at https://raw.githubusercontent.com/David-VTUK/istioexample/master/webapp.yaml

To accomplish this we need to implement two key objects:

Gateway

This is our entry point into our application. By default, Istio deploys the gateway object (we must note the external IP)

kubectl get svc -n istio-system
NAME                     TYPE           CLUSTER-IP       EXTERNAL-IP                
istio-citadel            ClusterIP      10.100.200.47                        
istio-galley             ClusterIP      10.100.200.149                       
istio-ingressgateway     LoadBalancer   10.100.200.244   10.10.20.150,100.64.80.1   
istio-pilot              ClusterIP      10.100.200.170                       
istio-policy             ClusterIP      10.100.200.3                        
istio-sidecar-injector   ClusterIP      10.100.200.169                   
istio-telemetry          ClusterIP      10.100.200.141                      
prometheus               ClusterIP      10.100.200.238                     

We configure the Gateway by deploying a gateway manifest file:

apiVersion: networking.istio.io/v1alpha3
kind: Gateway
metadata:
  name: http-gateway
spec:
  selector:
    istio: ingressgateway # use Istio default gateway implementation
  servers:
  - port:
      number: 80
      name: http
      protocol: HTTP
    hosts:
    - "*"              
  • Kind : Type of object. Gateway is a CRD (Custom Resource Definition) that Istio implements
  • Selector: What this applies to, in this case the default Ingress Gateway
  • Ports: Which ports we want to listen to on the external IP address, together with a name and protocol
  • Hosts : We can implement layer 7 load balancing on the edge, but as I’ll be testing this out via IP address, “*” will suffice. In production, this would likely be an FQDN of an external facing website


VirtualService

gateway object helps us define the entry point into the cluster, but we have yet to effectively tell the gateway where to route traffic to. This is where the VirtualService object type comes in. This is where we define routing intelligence.

apiVersion: networking.istio.io/v1alpha3
kind: VirtualService
metadata:
  name: demoapp
spec:
  hosts:
  - "*"
  gateways:
  - http-gateway
  http:
  - route:
    - destination:
        port:
          number: 80
        host: vt-webapp-v1.app-with-injection.svc.cluster.local
      weight: 80
    - destination:
        port:
          number: 80
        host: vt-webapp-v2.app-with-injection.svc.cluster.local
      weight: 20      

What the above effectively does is listen for all HTTP requests (hence the “*” under “hosts”) and route 80% of traffic to V1 of the webapp, by directing traffic at the respective service and 20% to v2.

Testing

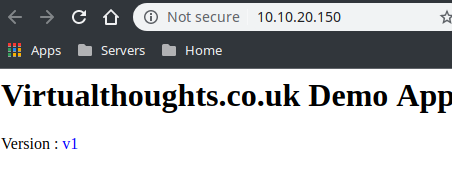
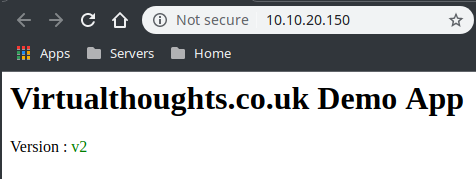
The “WebApp” is pretty simple. It simply displays one of the following (depending on the version)


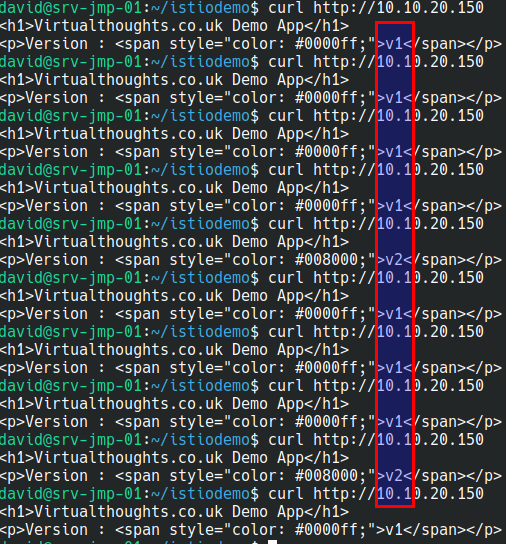
What we should now see from accessing the external IP is traffic being split across both services via a 80/20 split:

Out of 10 curl commands 8 were routed to v1 of my app, 2 were routed to v2 of my app.

Conclusion

Admittedly, this is an extremely simple example of a more simple use case of Istio, but as I’m learning, I think it’s a decent start, and I hope others find it useful.

Introducing Velero – Backup and DR for Kubernetes Applications

Image result for velero logo heptio


What is Velero?

Velero (previously known as Heptio ARK) provides a suite of tools to backup Kubernetes resources and applications for two main purposes:

  • Disaster Recovery – Recover Kubernetes cluster components and applications.
  • Migration – Migrate your Kubernetes applications to another Kubernetes cluster.

Migrating Kubernetes applications is a compelling use case. One of the significant benefits of using Kubernetes is the predictability of the platform and consequently the portability of applications that reside on it. With the main exception of nuances with persistent storage, the Kubernetes API will fell almost indistinguishable whether it resides on prem, GKE, AKS, EKS and elsewhere. If you have your Kubernetes-based application on one provider and want to migrate it to another or duplicate it to run elsewhere for dev/test, this can easily be achieved. Especially with Velero.


Install and Configure Velero

Velero consists primarily of the server (runs in a container) a storage location (ie S3 bucket) and the CLI.

Rather than reiterate what’s already in Velero’s existing and comprehensive documentation, the straight forward instructions are located https://heptio.github.io/velero/master/.


Demo App

To understand and get to grips with Velero I decided to write my own application. It’s a really simple application written in Golang and does the following:

  • Every 2 seconds, output the contents of /mnt/data/data.txt with a timestamp.

The pod will mount /mnt/data as a persistent volume based on the respective claim. The file it reads is “data.txt” which contains “some data”. The PV type is hostpath, which is suitable for testing in this single worker node cluster.

The overall solution is depicted below:

After deploying the application, we can validate it’s working as expected by inspecting the stdout file descriptor with kubectl logs:

Execute a backup (Note that in production this would likely be scheduled, and this backup includes everything. Ideally, you’d probably want to back up on a per namespace or app basis).

Validate the backup:

We can also see the backup residing in the previously defined S3 bucket:

Simulating a Disaster and Restoring

To simulate a disaster, I’ll simply remove my Pod, PV and PVC:

And for good measure, issue the same command previously used to extrapolate the logs:

We can use the velero restore command to pull the backup from our S3 bucket and restore our application.

Validate the restore:

Note that because the previous backup encompassed all namespaces and all resource types, Velero employs some logic to determine which objects it should restore, based on what already exists. However, my app, its namespace, PV and PVC has been restored, which we can validate with:

Closing Thoughts

Being able to mobilise a Kubernetes-based application on virtually any Kubernetes-based cluster is one of many compelling reasons to leverage this technology. Equally as important as ensuring availability and reliability of applications is to adopt a solid backup and disaster recovery solution. Velero is designed to facilitate this, and its flexibility in where to store and retrieve backups from helps with preventing lock-in with a particular solution, provider or vendor. Whether it’s on prem, Azure, Google Cloud, AWS, Digital Ocean or others, disasters do happen, downtime occurs. Being able to lift and shift entire cluster resources in a standardised is quickly becoming a solid requirement for modern applications.

Bootstrapping Prometheus, Grafana and Alertmanager to PKS deployed K8s Clusters

PKS is a comprehensive platform for the provisioning and management of Kubernetes clusters, which can be further enhanced by leveraging its extensibility options. In this post, we will modify a plan to deploy a yaml manifest file which provisions Prometheus, Grafana, and Alertmanager backed by NSX-T load balancers.

Why Prometheus, Grafana and Alertmanager?

The Cloud Native Computing Foundation accepted Prometheus as its second incubated project, the first being Kubernetes. Originally developed by SoundCloud. It has quickly become a popular platform for the monitoring of Kubernetes platforms. Built upon a powerful analytics engine, extensive and highly flexible data modeling can be accomplished with relative ease.

Grafana is, amongst other things, a visualisation tool that enables users to graph, chart, and generally visually represent data from a wide range of sources, Prometheus being one of them.

AlertManager handles alerts that are sent by applications such as Prometheus and performs a number of operations such as deduplicating, grouping and routing.

What I wanted to do, as someone unfamiliar with these tools is to devise a way to deploy these components in an automated way in which I can destroy, and recreate with ease. The topology of the solution is depicted below:


Constructing the manifest file

TLDR; I’ve placed the entire manifest file here, which creates the following:

  • Create the “monitoring” namespace.
  • Create a service account for Prometheus.
  • Create a cluster role requires for the Prometheus service account.
  • Create a cluster role binding for the Prometheus service account and the Prometheus cluster role.
  • Create a config map for Prometheus that:
    • Defines the Alertmonitor target.
    • Defines K8S master, K8S worker, and cAdvisor scrape targets.
    • Defines where to input alert rules from.
  • Create a config map for Prometheus that:
    • Provides a template for alerting rules.
  • Create a single replica deployment for Prometheus.
    • Expose this deployment via “LoadBalancer” (NSX-T).
  • Create a single replica deployment for Grafana.
    • Expose this deployment via “LoadBalancer” (NSX-T).
  • Create a single replica deployment for Alertmonitor.
    • Expose this deployment via “Loadbalancer” (NSX-T).


Bootstrapping the manifest file in PKS

Log into Ops manager and select the PKS tile:

Select a plan from the left-hand side, record the plan name for later:

Scroll down and paste the aforementioned YAML file into the Add-ons section

Save and then provision a cluster using the aforementioned plan:


david@mgmt-jumpbox:~$ pks create-cluster k8s --external-hostname k8s.virtualthoughts.co.uk --plan medium-with-prometheus-grafana-alertmanager --num-nodes 2

After which execute the following to acquire the list of loadbalancer IP addresses for the respective services:

david@mgmt-jumpbox:~$ kubectl get svc -n monitoring
NAME           TYPE           CLUSTER-IP       EXTERNAL-IP                 PORT(S)        AGE
alertmanager   LoadBalancer   10.100.200.218   100.64.96.5,172.16.12.129   80:31747/TCP   100m
grafana        LoadBalancer   10.100.200.89    100.64.96.5,172.16.12.128   80:31007/TCP   100m
prometheus     LoadBalancer   10.100.200.75    100.64.96.5,172.16.12.127   80:31558/TCP   100m

Prometheus – Quick tour

Logging into http://prometheus-lb-vip/targets will list the list of scrape targets for Prometheus, which have been configured via the respective configmap and include:

  • API server (Master)
  • Nodes (Workers)
  • cAdvisor (Pods)
  • Prometheus (self)

Which can be graphed / modelled / queried:


Grafana – Quick Tour

Out of the box, Grafana has very limited configuration applied – I struggled a little bit with constructing a configmap that would automatically add Prometheus as a data source, so a little bit of manual configuration is required (for now). Accessing http://grafana-lb-vip will prompt for a logon: (admin/admin) is the default


Add a data source:

Hint : use “prometheus.monitoring.svc.cluster.local” as the source URL

After creating a dashboard (or importing one) we can validate Grafana is extracting information from Prometheus


Alertmanager – Quick Tour

Alertmanager can be accessed via http://alertmanager-lb-vip. From the YAML manifest it has a vanilla config, but Prometheus is configured to use it as a alert target via the configmap:

  prometheus.yml: |-
    global:
      scrape_interval: 5s
      evaluation_interval: 5s
      
    alerting:
      alertmanagers:
        - static_configs:
          - targets: 
            - "alertmanager.monitoring.svc.cluster.local:80"

Alerts need to be configured in Prometheus in order for Alertmanager to ingest / deduplicate / forward etc.

As an example, I tested some integration with Discord:

Practical to send alerts to a Discord sever? Probably not.

Fun? Yes!

« Older posts Newer posts »

© 2024 Virtual Thoughts

Theme by Anders NorenUp ↑

Social media & sharing icons powered by UltimatelySocial
RSS
Twitter
Visit Us
Follow Me