Virtualisation, Storage and various other ramblings.

Author: David (Page 17 of 24)

My Technology Hitlist for 2018

It’s time for me to set a few objectives with which technologies I want to learn more about in 2018. As a reminder for me and to try and not lose focus, I’ve compiled it into a blog post.


vRealize Automation / Orchestration

I’ve always dabbled in automation and orchestration but never really gone “full on”.  I used to write a lot of scripts for migrations and such “back in the day”, so I’ll be looking forward to getting my hands dirty again and messing around with automating and orchestrating….all the things.


Docker / Containers

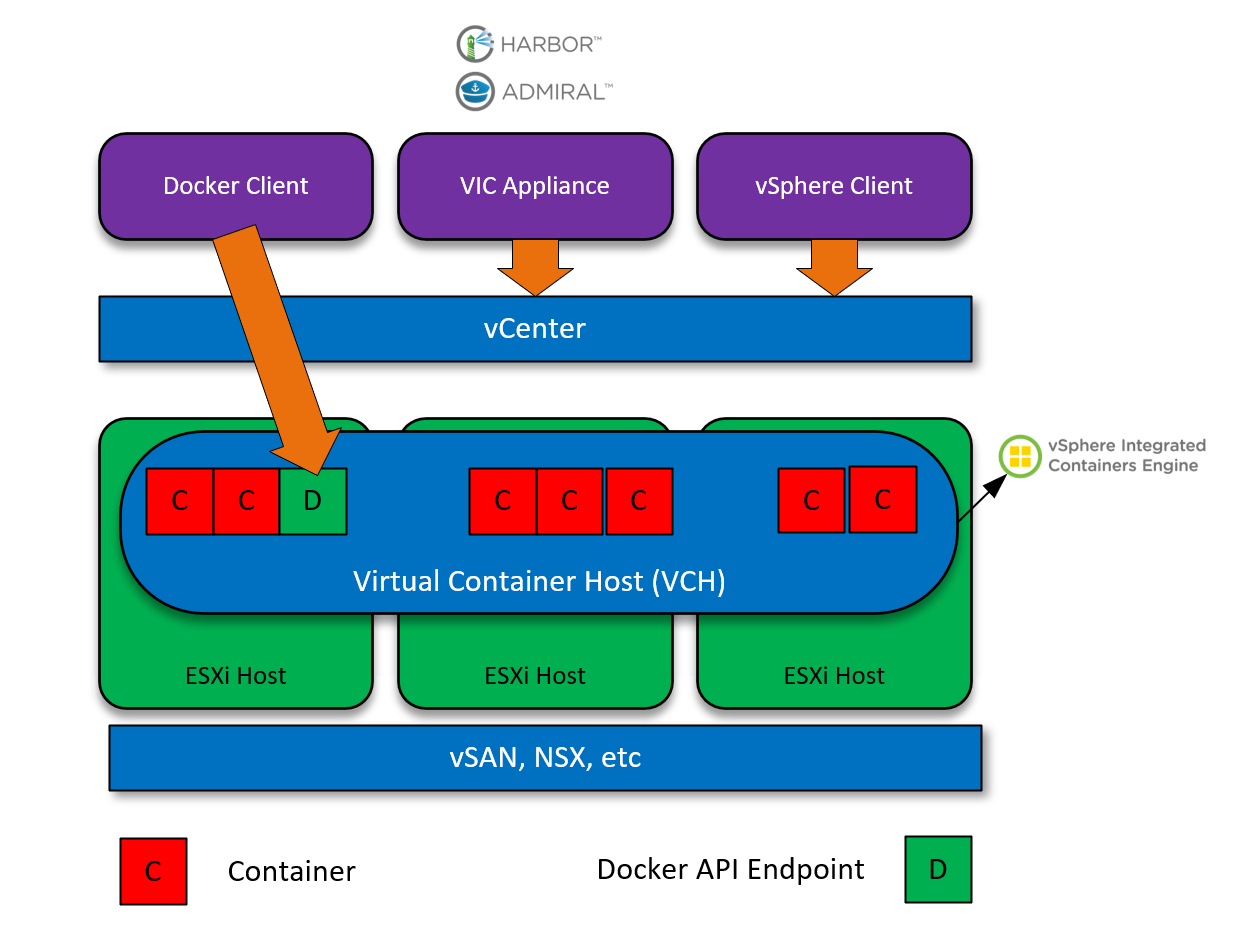
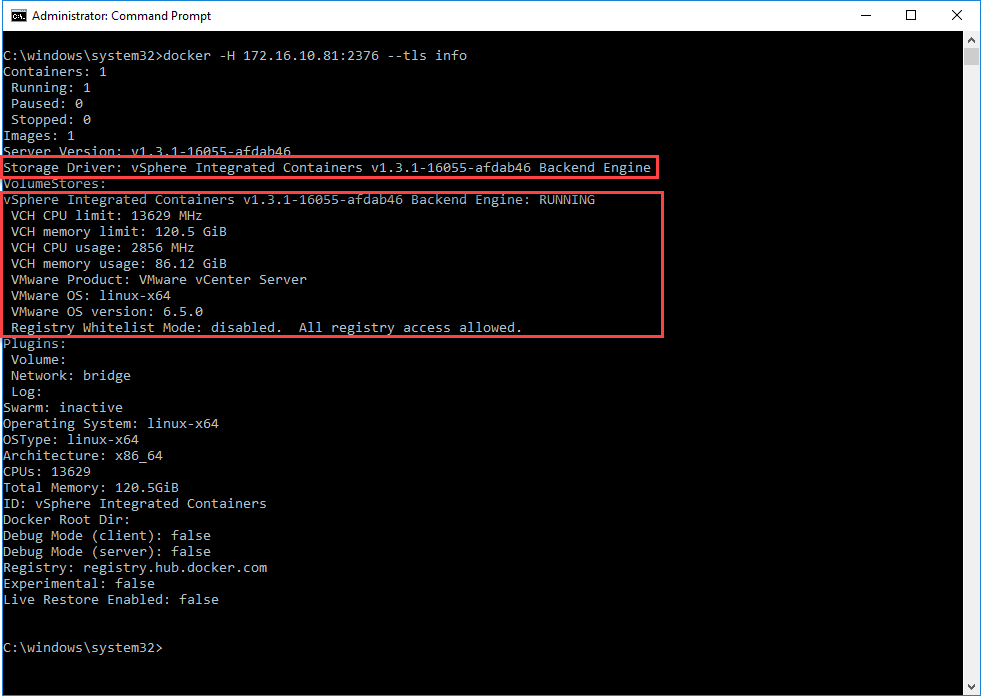
My career pretty much started with mainstream x86 server virtualisation. P2V’s were rife and everyone was losing their minds with technologies such as vMotion. The industry has changed now, and I personally feel the next wave of change in the way we manage applications and the underlying operating system libraries is with containers. Docker is leading the charge and this ties nicely with Automation and Orchestration. VMware integrated containers intrigues me as well, as it bridges a gap between the ops teams that are used to, and familiar with vSphere but are experiencing even more demand to provision, manage, secure and automate containers.

Containers are nothing new and are currently loved by the likes of developers, but from what I’ve read/heard/seen, typical enterprises are approaching with caution.

Kubernetes

Pretty much a follow on from containers. This, in my opinion, is the key driver to take [insert container engine of choice] to prime time, typical enterprise consumption. We all know the likes of Netflix, Facebook, Google are already using containers en masse and with an eye-watering amount of orchestration behind it, but I personally think the uptake from typical enterprises is a lot slower, particularly outside of Dev/Test but we’re getting there.


NSX-T

Fitting in with VMware’s ethos of any cloud, any device, anywhere, NSX-T sits as the hyperivsor-agnostic SDN solution. Having already dabbled quite a lot in NSX-V, I’d like to know more about NSX-T and the auxiliary technologies.


Google Cloud

Although some would consider late to the game, I think Google Cloud has potential. I’m already familiar with AWS and I think it’s a good idea to learn another cloud technology, so GCP it is.

Why not Azure? – I’m just not a Microsoft person anymore. Years ago (before Azure was even a thing) I used to be all over Windows Server, AD, Exchange, Group Policies, IIS, DHCP, WSUS etc, took the exams etc. After years of managing this ecosystem, I lost my enthusiasm for it. Bodged windows updates, Windows Server “quirks” and the like – couldn’t deal with it. Therefore I stay away.

“%20” free space on my NIC card? Good job, Windows.

Heck, if work would permit it, I’d run Linux on my company laptop.

Certifications?

Ideally this year I’d like to get:

  • VCIX-NV
  • Docker Certified Associate
  • Certified Kubernetes Administrator
  • VCP7-CMA


Understanding Data Center traffic flow using NSX-V capabilities

The defining characteristic of the Software Defined Data Center (SDDC), as the name implies, is to bring the intelligence and operations of various datacenter functions into software. This type of integration provides us with the ability to gain insights and analytics in a much more controlled, tightly integrated fashion.

VMware NSX is the market leader in network virtualisation. In this post, we have a look at a selection of tools which come with NSX, enabling a greater understanding of exactly what is transpiring in our NSX environment.


What we do now

Before diving into NSX-V traffic flow capabilities, let’s take a step back into how some organisations may approach identifying traffic flows currently by taking a simple example issue:

“Server A can’t talk to Server B on port 8443”

In this example, we assume that Server B is listening on port 8443.

Here are a few tools/methods that can be used to help identify the root cause


What these tools/methods have in common are:


  • Disjointed – Treated as separate, discrete exercises.
  • Isolated – Requires specific tools/skillsets.
  • Decentralised – Analysis requires output to be crossed referenced and analysed manually.


How NSX-V native tools can help

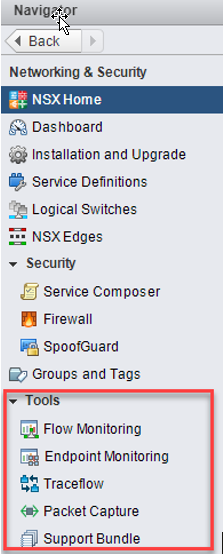
NSX-V provides us with a number tools to help us gain a deeper understanding of our network environment as well as provide accelerated troubleshooting and root cause analysis. These can be found via the vCenter client:


Flow Monitoring

Flow Monitoring is one of the traffic analysis tools that provide a detailed view of the traffic originating and terminating at virtual machines. One example use case of this is to determine in real time the traffic flows originating from a virtual machine – the below example demonstrating this. No agent or VM configuration is needed, unlike with Wireshark – NSX does this all natively without any modifications to the VM:


The VM in the example above has an IP of 172.16.201.10. We can see that itself is making DNS calls out to 8.8.8.8 as well as communicating with another machine with an IP of 172.16.200.10 over port 8443.

Endpoint Monitoring


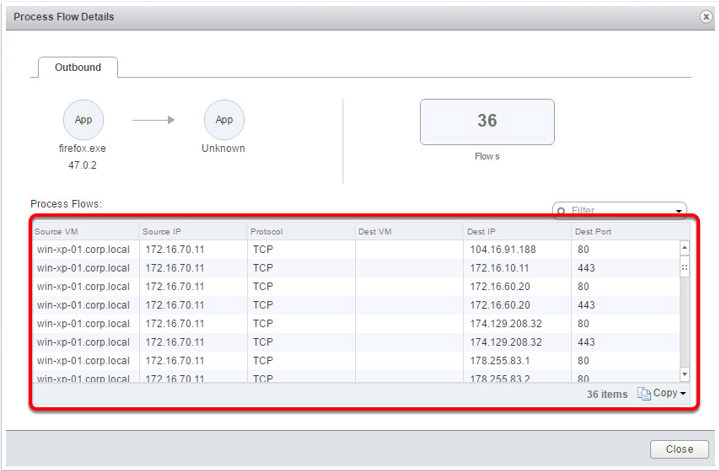
Endpoint Monitoring enables us to map specific processes inside a guest operating system to network connections that are facilitating this traffic. This is helpful for gaining insight into application-layer details. The examples shown below demonstrate NSX’s ability to identify:

  • The source of the flow (process or application)
  • The source VM
  • The destination (can be any destination)
  • Traffic Type


Traceflow

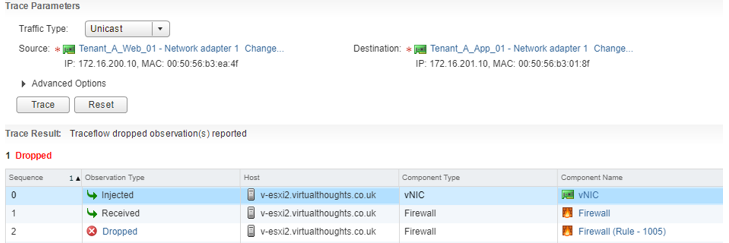
Traceflow acts as a very useful diagnostic tool. Compared to flow monitoring, which takes a real-time view of network traffic, traceflow allows us to simulate traffic by synthetically “injecting” this traffic into our environment and monitoring the data path. In this example a test was executed for connectivity from a web server to an App server over port 8443:


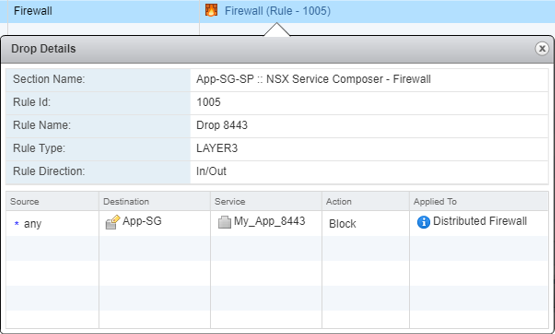
NSX has informed us that this packet was dropped due a firewall rule – it also gives us the Rule ID in question. We can click on this link to get more information about this rule:


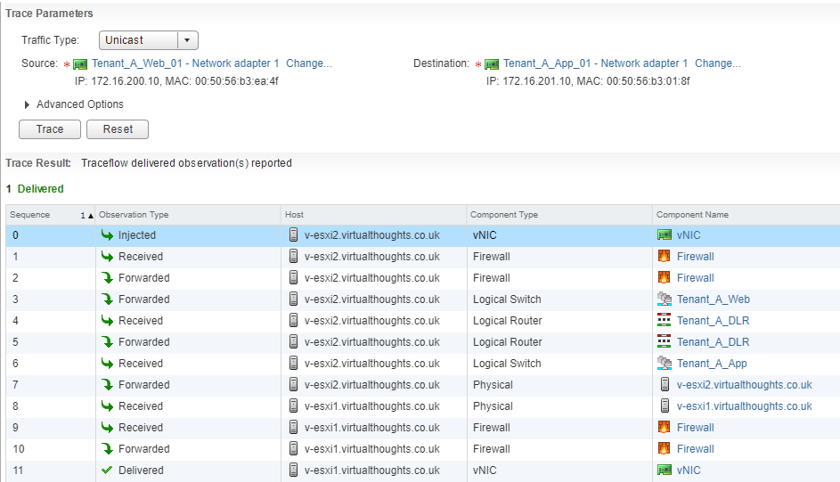
Once this rule was modified we can re-run the test, which shows this traffic has been successfully delivered to the target VM.

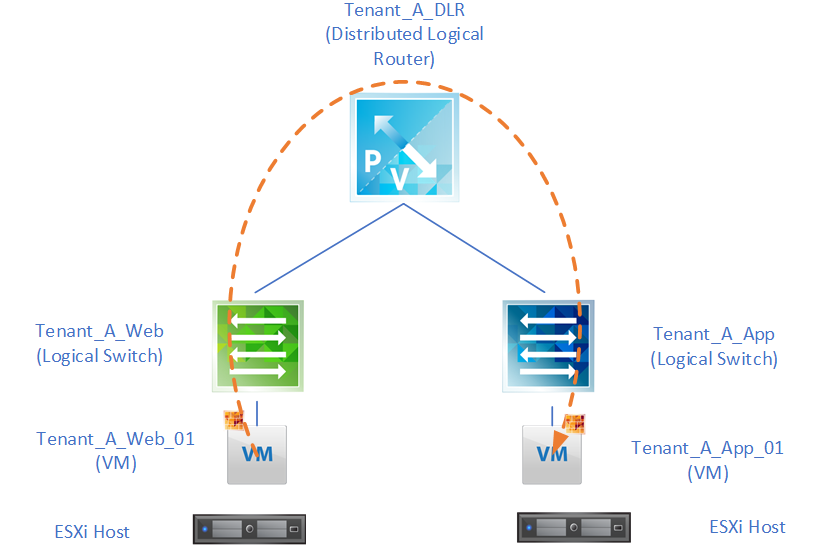
Traceflow also gives us an idea as to the journey our packet has travelled. From the above output we can see that this packet has traversed two logical switches, two ESXi hosts, one distributed logical router, and has forwarded through the distributed firewall running on the vNIC’s of two VM’s:


Packet Capture

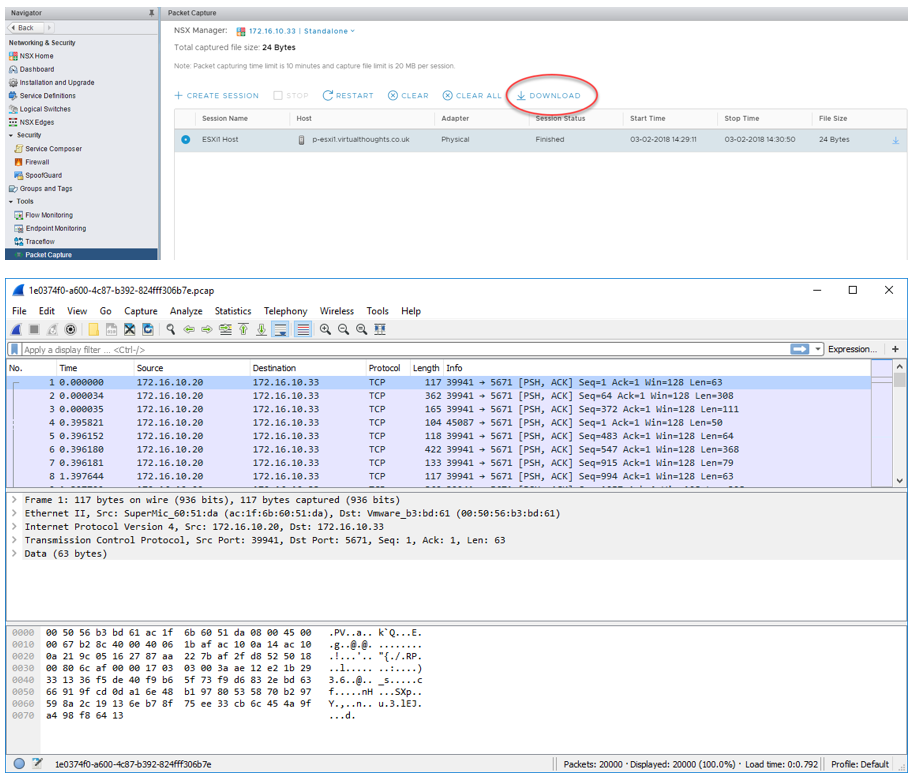
The Packet Capture feature in NSX-V enables us to generate packet traces from physical ESXi hosts should we wish to perform any troubleshooting at that level.

These captures are done on a per-host level and we can specify to gather packet captures from one of the following interface types:

  • Physical NIC
  • VMKernel Interface
  • vNIC
  • vDR Port

Or from one of the respective filter types. Once started NSX will start gathering packet logs. Once the session has stopped these can be downloaded as .PCAP files which can be opened with a tool such as Wireshark


Conclusion

As organisations are adopting software-defined technologies, the tools and processes we use must also change. Thankfully, NSX-V has a plethora of native capabilities to observe, identify and troubleshoot software-defined networks.

vRealize Log insight – Frequently Overlooked Centralised Log Management

Log analysis has always been a standardised practice for activities such as root cause analysis or advanced troubleshooting. However, ingesting and analysing these logs from different devices, types, locations and formats can be a challenge. In this post, we have a look at vRealize Log Insight and what it can deliver.


What is it?

vRealize Log Insight is a product in the vRealize suite specifically designed for heterogeneous and scalable log management across physical, virtual and cloud-based environments. It is designed to be agnostic across what it can ingest logs from and is therefore valid candidate in a lot of deployments.

Additionally, any customer with a vCenter Server Standard or above license is entitled to a free 25 OSI pack. OSI is known as “Operating System Instance” and is broadly defined as a managed entity which is capable of generating logs. For example, a 25 OSI pack license can be used to cover a vCenter server, a number of ESXi hosts and other devices covered either natively or via VMware Content Packs (with the exception of Custom and 3rd party content packs – standalone vRealize Log Insight is required for this feature).


Current Challenges

Modern datacenters and cloud environments are rarely consumed by homogeneous solutions. Customers use a number of different technologies from different vendors and operating systems. With this comes a number of challenges:


  • The inconsistent format of log types – vCenter/ESXi uses syslog for logging, Windows has a bespoke method, applications may simply write data to a file in a specific format. This can require a number of tools/skills to read, interpret and action from this data.
  • Silos of information – The decentralised nature of dispersed logging causes this information to be siloed in different areas. This can have an impact on resolution times for incidents and accuracy of root cause analysis.
  • Manual analysis – Simply logging information can be helpful, but the reason why this is required is to perform the analysis. In some environments, this is a manual process performed by a systems administrator.
  • Not scalable – As environments grow larger and more complex having silos of differentiating logging types and formats becomes unwieldy to manage.
  • Cost – Man hours used to perform manual analysis can be costly.
  • No Correlation – Siloed logs doesn’t cater for any correlation of events/activities across an environment. This can greatly impede efforts in performing activities such as root cause analysis.


Addressing Challenges With vRealize Log Insight

Below are examples of how vRealize Log Insight can address the aforementioned challenges.


  • Create structure from unstructured data – Collected data is automatically analysed and structured for ease of reporting.
  • Centralised logging – vRealize Log Insight centrally collates logs from a number of sources which can then be accessed through a single management interface.
  • Automatic analysis – Logs are collected in near real-time and alerts can be configured to inform users of potential issues and unexpected events.
  • Scalable – Advanced licenses of vRealize Log insight include additional features such as Clustering, High Availability, Event Forwarding and Archiving to facilitate a highly scalable, centralised log management solution. vRealize Log Insight is also designed to analyse massive amounts of log data.
  • Cost – Automatic analysis of logs and alerting can assist with reducing man-hours spent manually analysing logs, freeing up IT staff to perform other tasks.
  • Log Correlation – Because logs are centralised and structured events across multiple devices/services can be correlated to identify trends and patterns.


Extensibility

vRealize Log Insight’s capabilities can be extended by the use of content packs. Content packs are available from the VMware marketplace (https://marketplace.vmware.com/vsx/?contentType=2)

Content packs are published either by VMware directly or from vendors to support their own devices/solutions. Examples include:

  • Apache Web Service
  • Brocade Devices
  • Cisco Devices
  • Dell | EMC Devices
  • F5 Devices
  • Juniper Devices
  • Microsoft Active Directory
  • Nimble Devices
  • VMware SRM


Closing Thoughts

It’s surprising how underused vRealize Log Insight is considering it comes bundled in as part of any valid vSphere Standard or above license. The modular design of the solution allowing third-party content packs adds a massive degree of flexibility which is not common amongst other centralised logging tools. 

« Older posts Newer posts »

© 2024 Virtual Thoughts

Theme by Anders NorenUp ↑

Social media & sharing icons powered by UltimatelySocial
RSS
Twitter
Visit Us
Follow Me